2023
Telos air
telosair.com
Background
Telos Air enhances indoor environments by monitoring and improving air quality. Founded in 2016 by Dr Suresh Dhaniyala, an expert in aerosol detection, we provide an end-to-end solution that analyzes air quality in real-time and integrates with building management systems to optimize airflow and pressure. Our advanced data visualizations make air quality insights accessible, helping institutions and businesses improve the air their communities breathe.
Core problem
The Old product of TelosAir is overly focused on engineering aspects, making it less user-friendly for the average user. While it would be beneficial to have a summary page providing a clear data overview, the current setup has several issues. The default sensor is always displayed, regardless of the number of sensors a user has, complicating specific insights. The page constantly refreshes, which can be disruptive and frustrating. Additionally, the widgets are not customizable, limiting users’ ability to tailor the dashboard to their needs. Crucially, there is no capability to compare data from multiple sensors across different data points, which is essential for comprehensive analysis. This comparison feature should be available, even if it doesn’t happen in the same place.
📌The problems are as follows:
Overly focused on engineering aspects
The current setup has several issues.
The sensor is always displayed
Page constantly refreshes
Disruptive and frustrating
Not customizable
Research and Analysis
Team → Sumit (Me) & Anudeep ( Mentor → Best mentor in my life )
My roles → Crafting end-to-end design solutions. From nothing to insightful HVAC Products of TelosAir
Project Duration → 2 months
Tools → Figma, Google Spreadsheets, Notion
PROJECT GOALS → Users need to get the best outlook of their systems
RESEARCH
The images below represent the old design of Telos Air. I began by thoroughly analyzing these design files to improve the product and address user challenges. I then engaged with stakeholders, asking targeted questions to gain deeper insights into user pain points and desired improvements. This process provided valuable information to guide the redesign and enhance the user experience.
Design Process
To gain deeper insights into the product and identify current issues, I began conducting interviews with stakeholders. My goal was to understand their challenges and why they needed a redesign or enhanced user experience. I approached this with a multitude of questions in mind, seeking to uncover effective solutions.
To delve deeper into the core issues, I employed the 5 Whys technique. This method helped me thoroughly understand the problems associated with the product by asking successive questions to reveal the root causes.
THE QUESTION I ASKED →
What verticals/industries — Manufacturing, Hospitals, Education (Universities & Schools) — Today? Commercial Offices (Tech Parks), Hotels — Future
Why will the sensor stop working? LORA communication can be a problem. Sensors could be unplugged. Gateway can be unplugged.
Does air quality have why more than 1 value (Mainly SI units)?
We provide the default value of these indexes as per the American Society Guidelines and also users able to change or manipulate the default value as per their choices?
What are functions available in Advance AQI?
If users see the data mainly on mobile then we have to create a web app for the same !!
On what base we can prioritize the most important to least important components?
The flow of the widget is like we show some summary or some relevant information but after clicking on the same widget, the user will find fast performance data or maybe more details about that widget in a separate or new screen → Reduce no of clicks.
How do we connect over reports and analytics?
THE INSIGHTS ARE →
After gathering insights and analyzing the data, I realized I missed some crucial questions for the stakeholders. These questions are essential for designing accurate persona mapping and addressing challenges related to sensors, temperature, and other sensor devices. Engaging with stakeholders again will provide valuable information to refine the design process and ensure all critical aspects are covered.
🤯The below image shows the question I missed
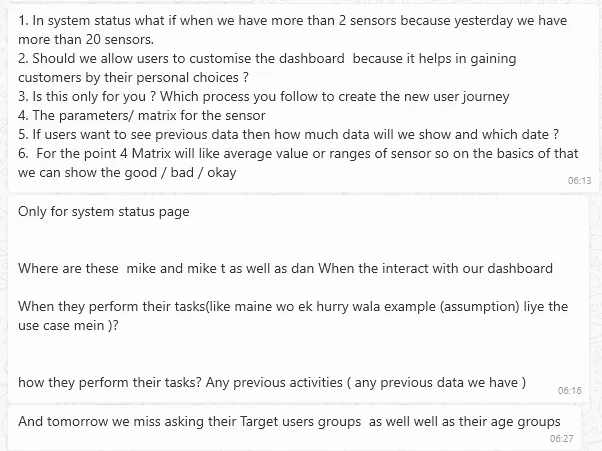
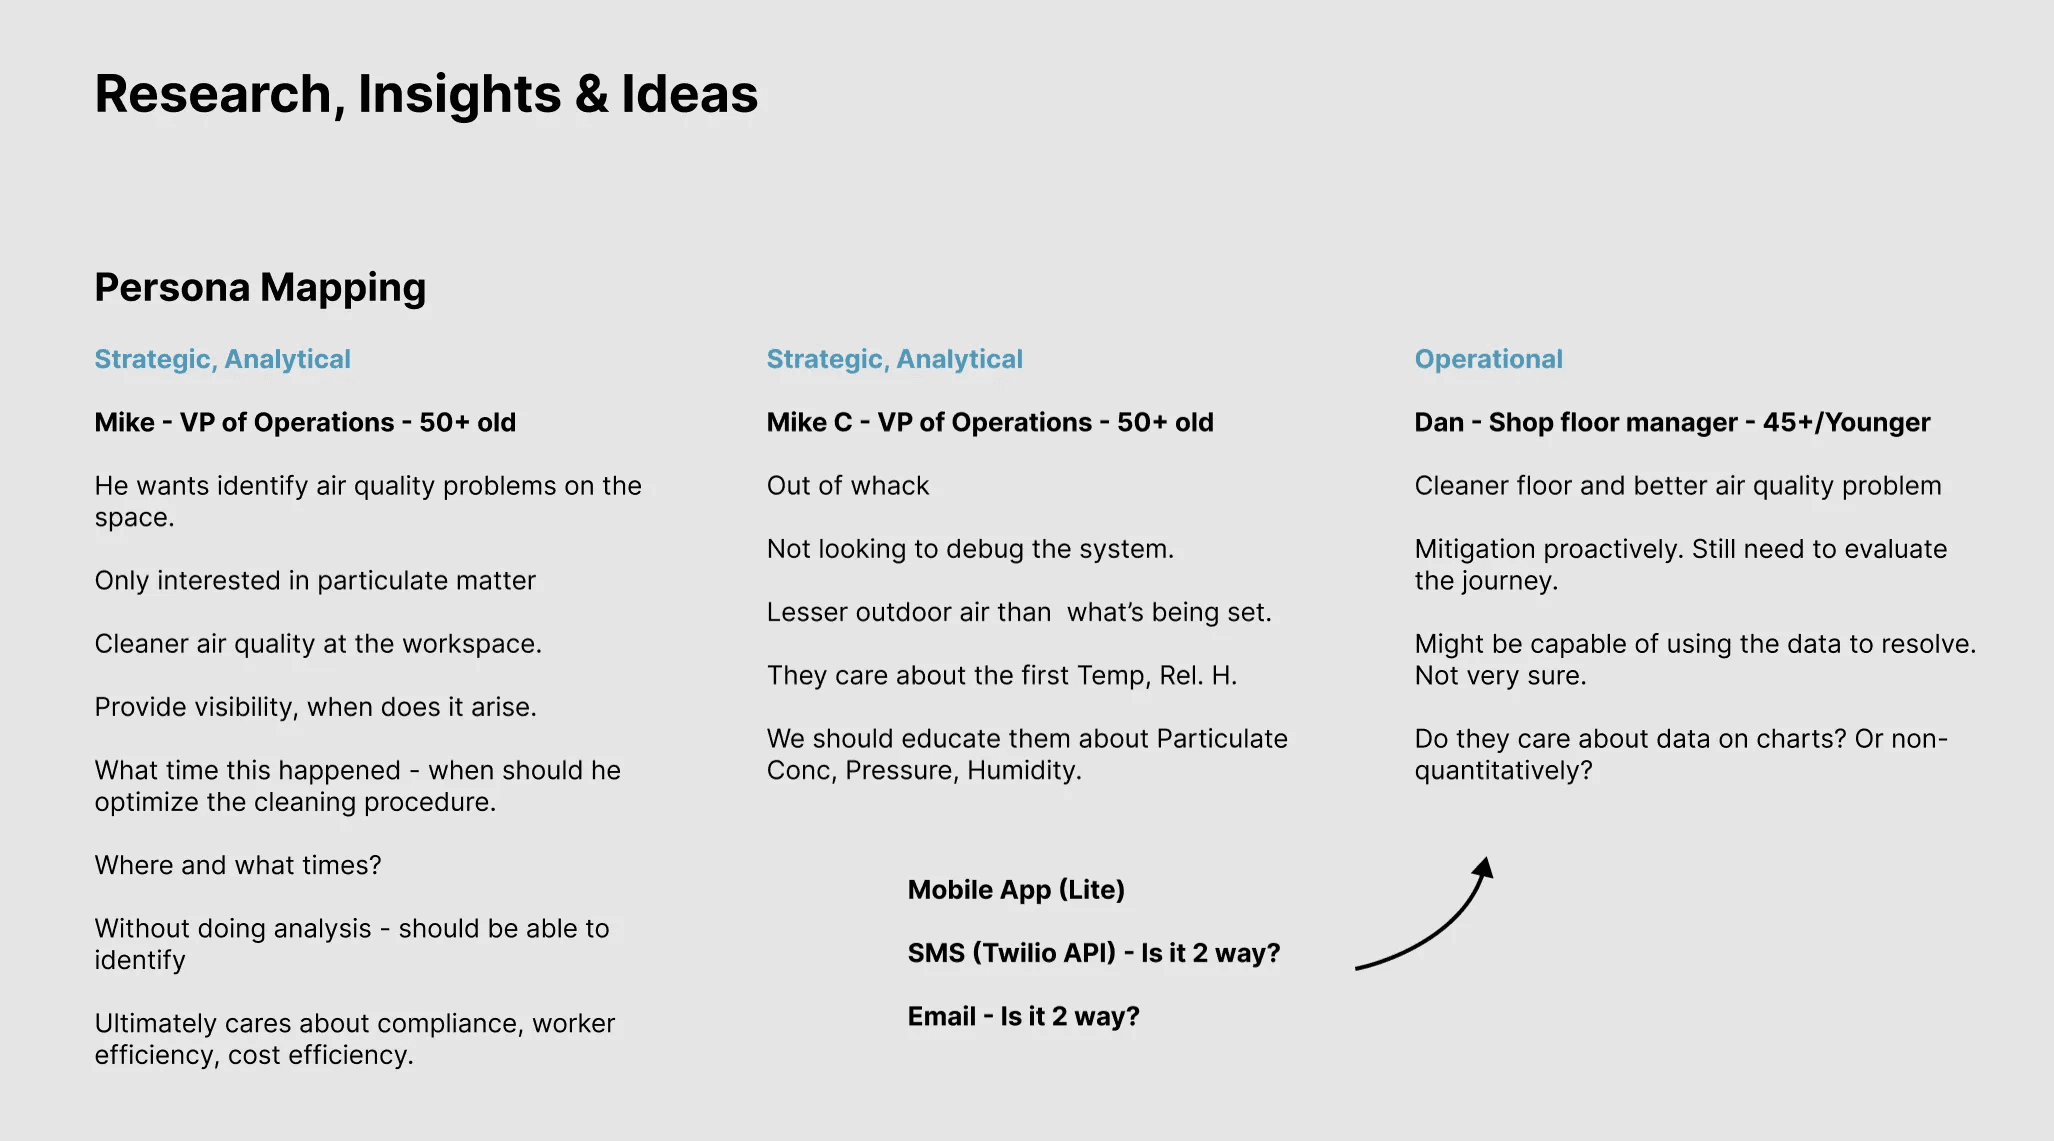
After analyzing all research data and mapping it, I created several personas for the product, incorporating their biographical and demographic information. The image below showcases the research insights for these personas.
After gathering some insights, I began conducting Market Awareness Mapping. This strategy helps me to understand and visualize the level of awareness and perception that a target audience has about a specific product, service, or brand within a given market. The image below illustrates the results of the awareness mapping for Telos Air.
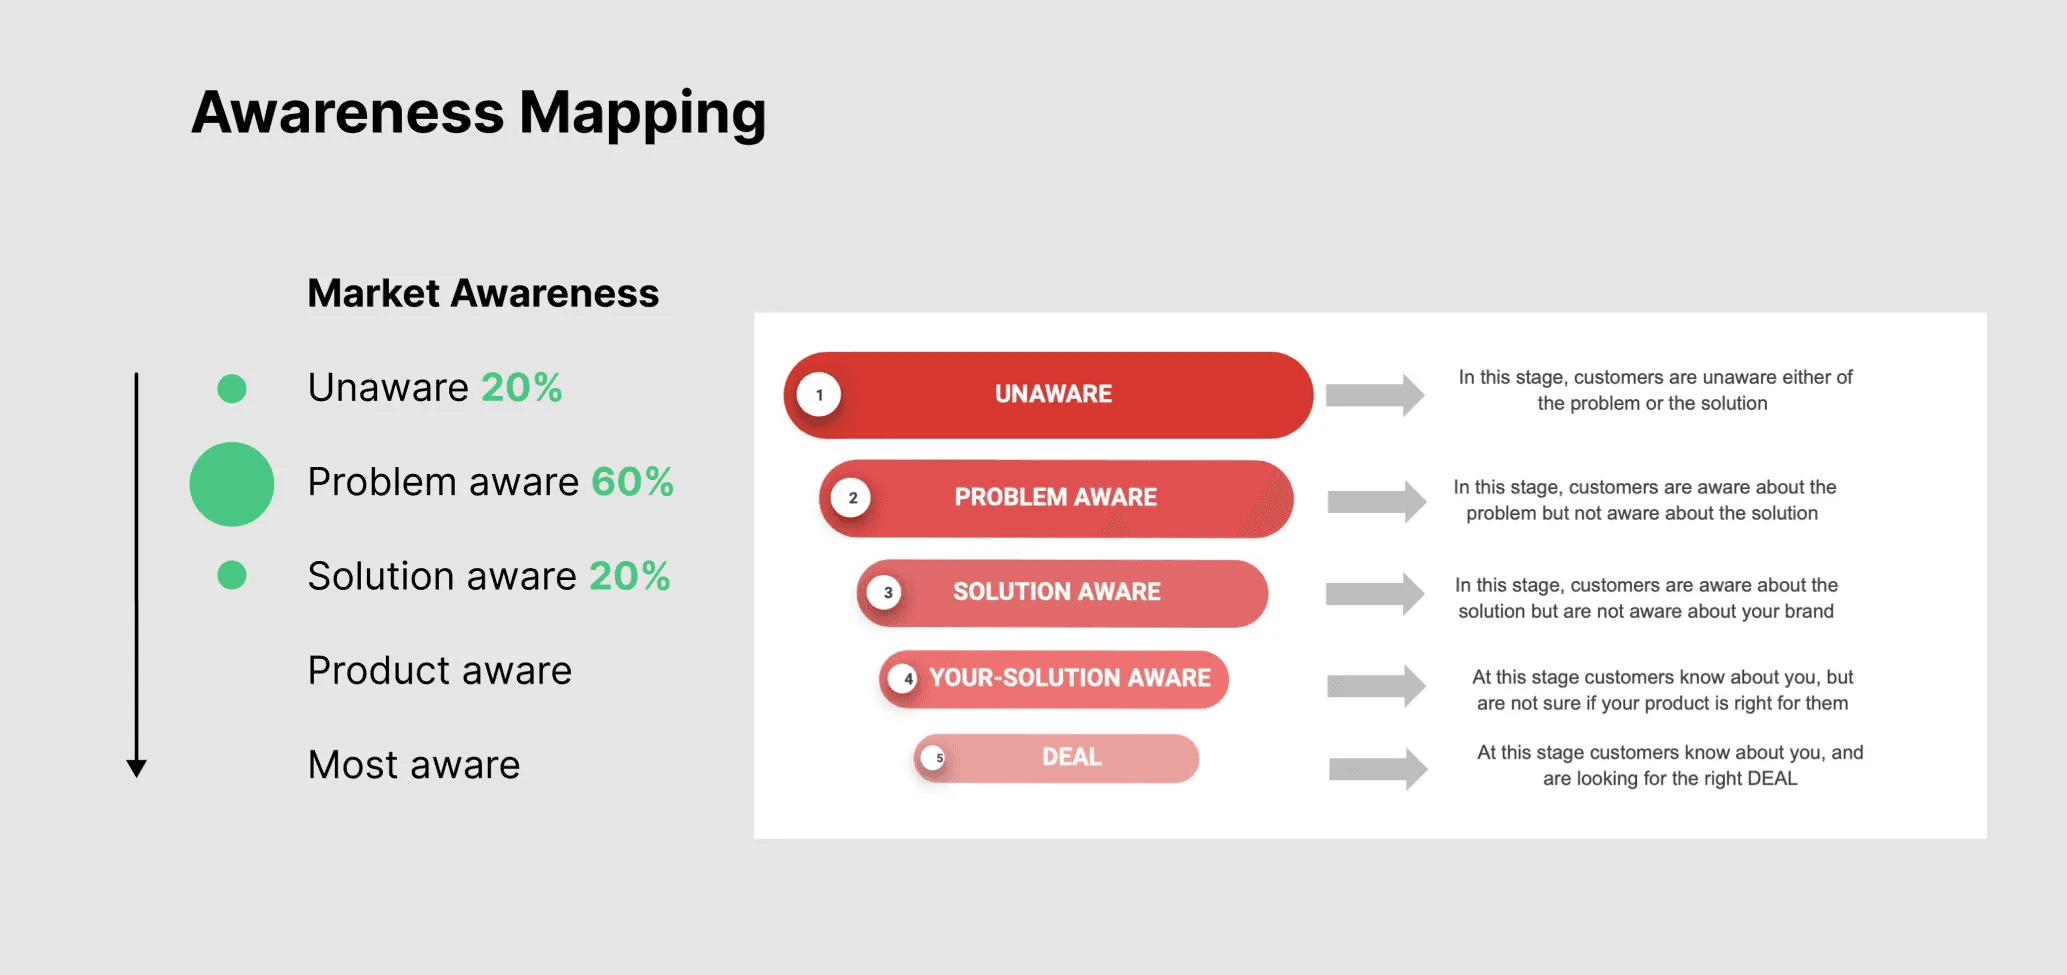
THE RESULTS OF AWARENESS MAPPING ARE →
Unaware → 20%
Problem Aware → 60%
Solution Aware → 20%
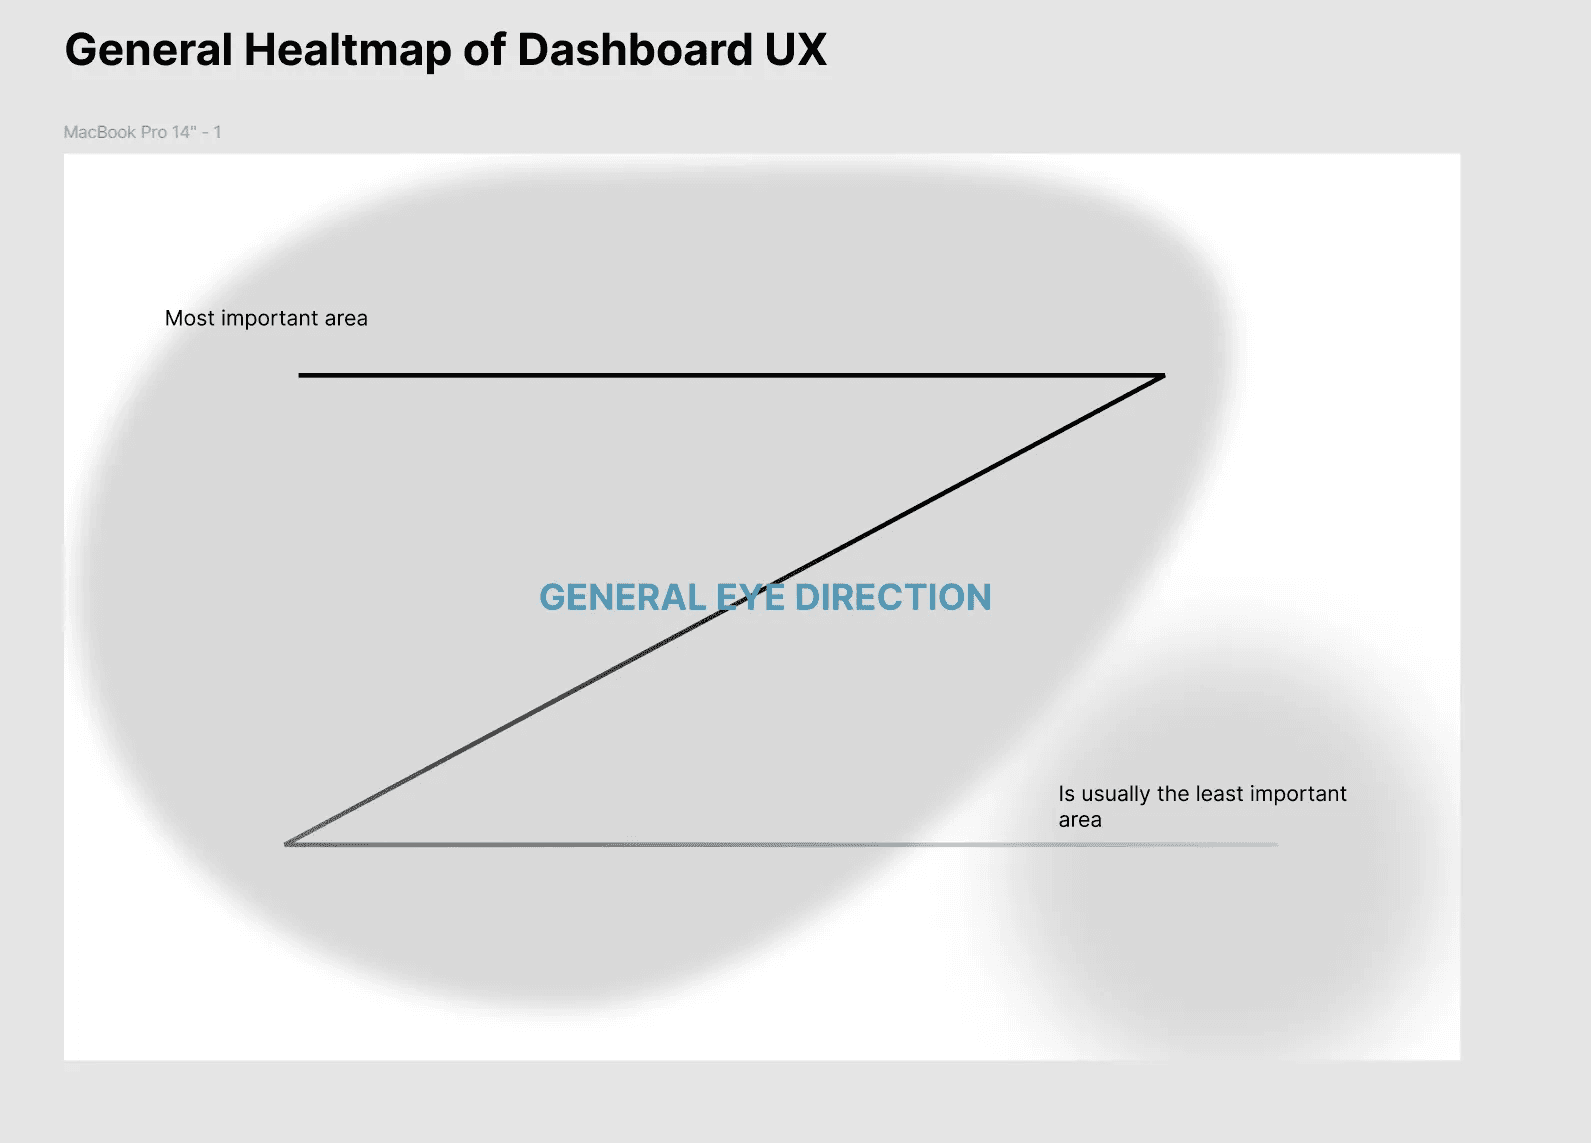
Recognizing that 60% of users are experiencing issues, I needed to design the best possible solution. I decided to create an HVAC (Heating, Ventilation, and Air Conditioning.) dashboard tailored to their needs. Before starting, I analyzed the heat map for the dashboard. This analysis allowed me to place the most important information in the hotspot areas, ensuring users are drawn to key insights and can take informed actions. Below is the heatmap for the dashboard.
Based on the personas, I listed all the necessary widgets and started reading books on widget design for dashboards. I discovered valuable insights on widget design and identified key questions that every problem solver should ask when designing widgets. The image below lists these crucial questions and widgets.
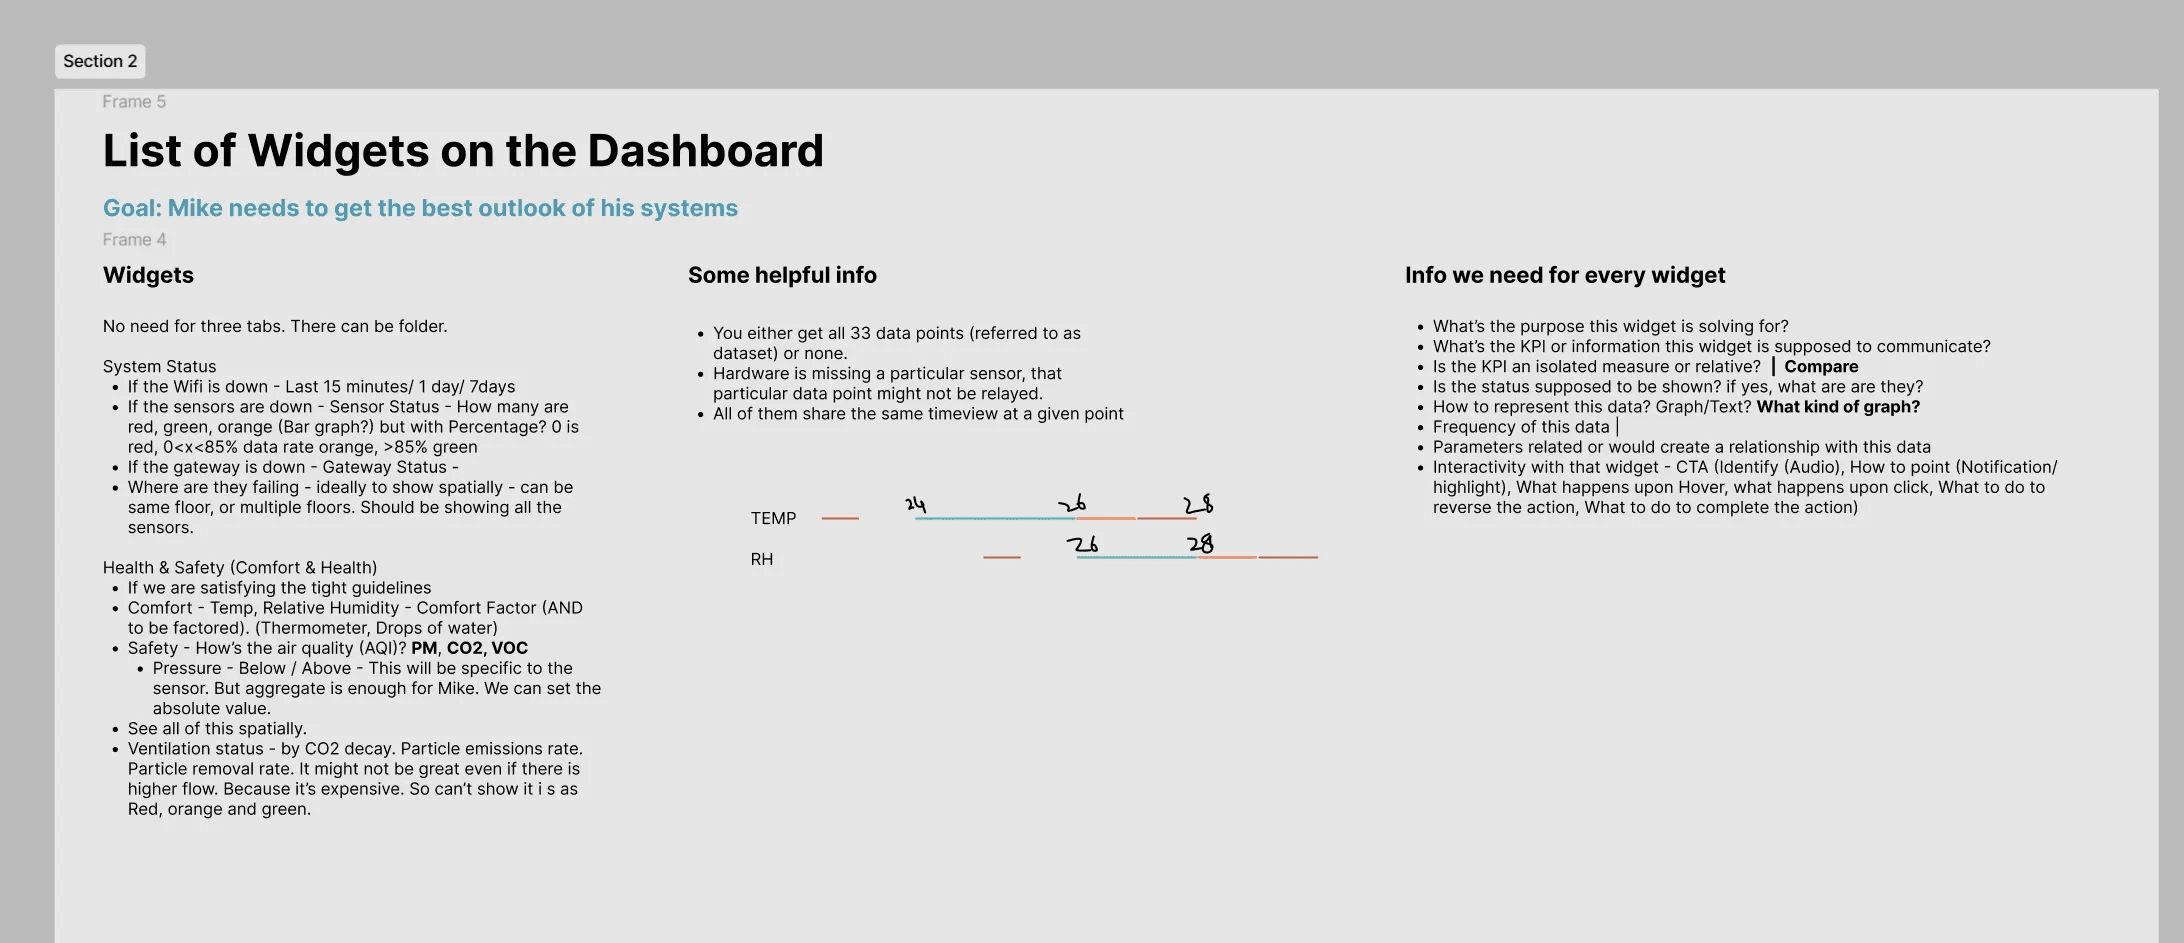
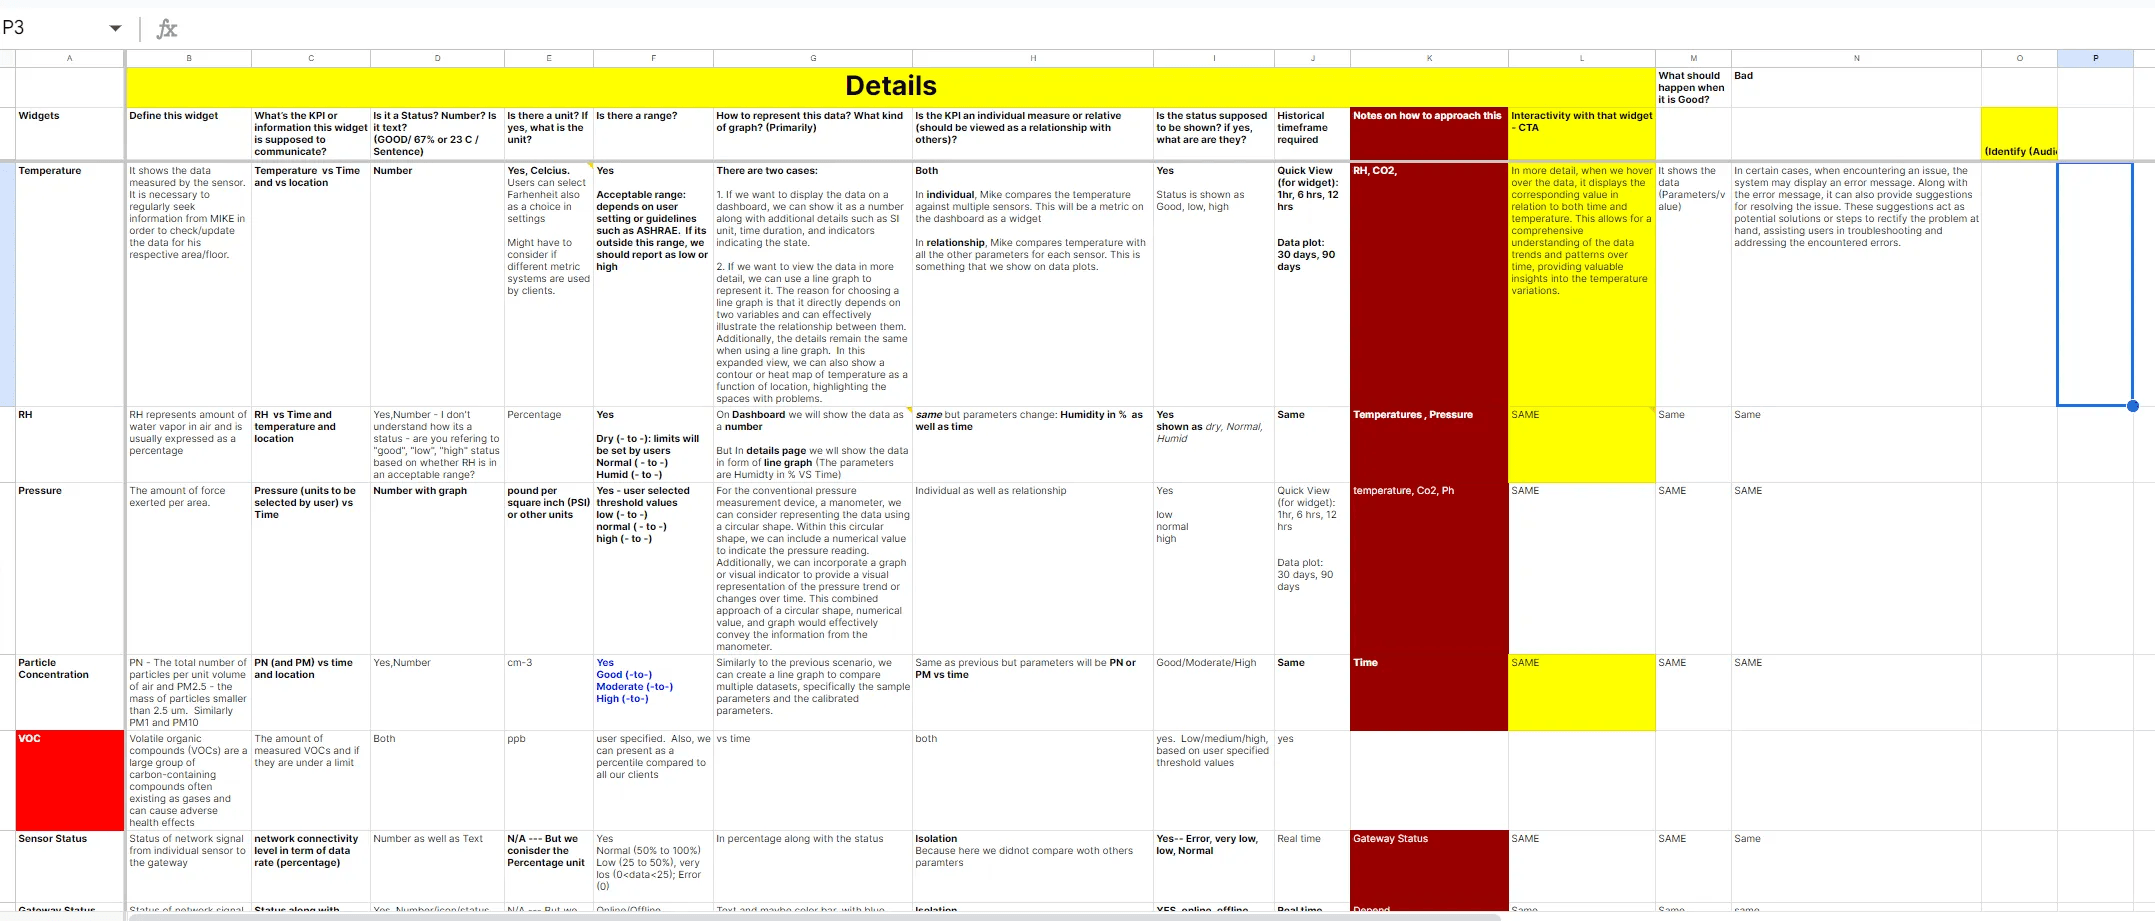
Accordingly, I created a spreadsheet to list down 14 questions for each of the 13 widgets. This approach helped me gain deeper knowledge about the widgets, as well as the relevant data matrices and KPIs associated with them.
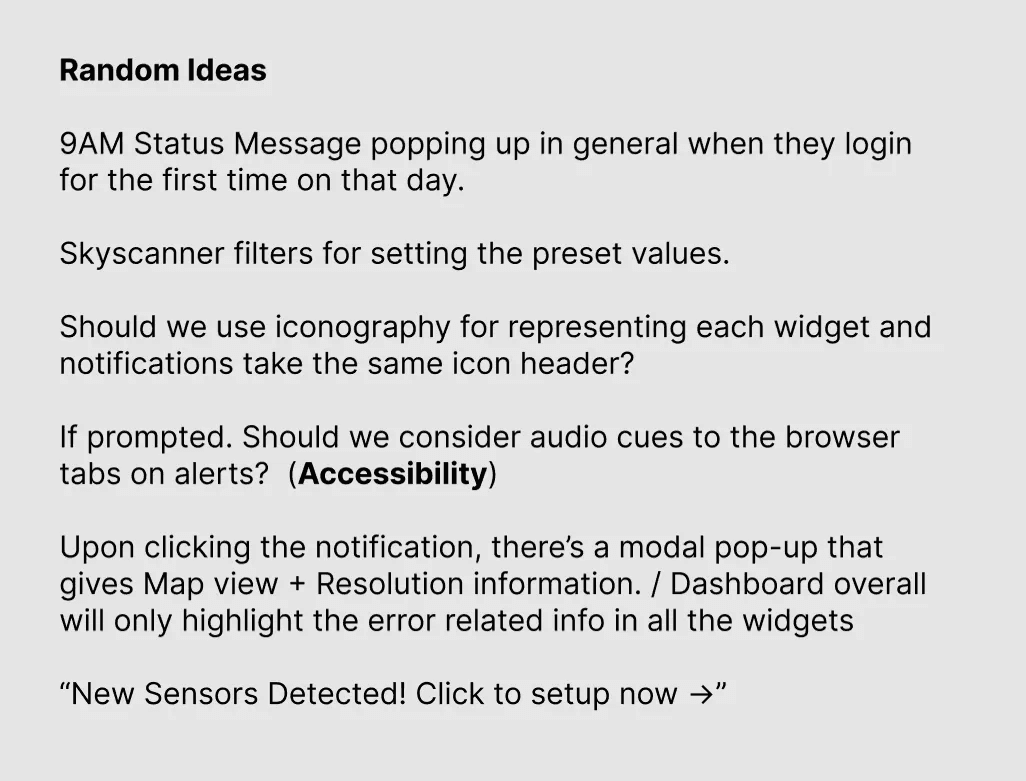
During my research and analysis of the TelosAir product, I generated several random ideas focused on usability and accessibility for users. One notable idea was inspired by the Skyscanner filter for presenting value. You can see these ideas in the image below. These insights emerged organically as I collected and analyzed the research data.
So far, I have completed the research, gathered insights, built personas, answered all stakeholder questions, and conducted interviews. I now have a clear understanding of the exact problems with the old design. The next step is to explore what other products are offering and what competitors are building. To differentiate TelosAir, I conducted a competitive analysis. The image below showcases this analysis and highlights the weaknesses of TelosAir in the current market scenario for air quality data. Additionally, I performed a SWOT analysis for TelosAir to make informed decisions on product design.
Competitive Analysis
Brand | USP | Target Market | Price ($) | Strengths | Weakness | Services / Factor | Key Features |
TelosAir | Solutions for a wider range of indoor spaces, end-to-end solutions, integrates with building management systems | Commercial, industrial, healthcare | 500 - 1000 | Wide range of sensors, scalable for larger buildings | Higher price point, may not suit small buildings or individuals | 6 factors | Not specified |
Airthings | User-friendly design, cloud-based data, radon detection, smart home integration | Residential, commercial | 200 - 400 | Good for DIY, easy install, accurate radon detection | Limited sensors, not for large buildings | Temp, humidity, VOC, radon | In-house team, 15 years in market, trust factor |
Foobot | AI-powered recommendations, smart home integration | Residential, small commercial | 180 - 250 | Personalized insights, easy setup | Limited sensors, not for large buildings | Temp, humidity, VOCs, PM2.5 | Focus on real estate, finance, HVAC manufacturers |
Netatmo | User-friendly, voice assistant integration, indoor/outdoor monitoring | Residential, small commercial | 99 - 230 | Easy to use, customizable alerts | Limited sensors, not for large buildings | Temp, humidity, CO2, VOCs | Subscription-free, privacy, data protection, durable, smart ecosystem |
Awair | AI-powered recommendations, sleek design | School, business, office | 209 - custom | Wide range of products | Limited sensors, high price | Temp, humidity, CO2, VOCs, PM2.5, noise, light | Health and safety, knowing air everywhere |
SWOT Analysis:
Strengths | Weaknesses | Opportunities | Threats |
Provides solutions for a wider range of indoor spaces | Higher price point may limit customer base | Increasing demand for indoor air quality solutions | Intense competition from established and emerging players |
End-to-end solutions | Not suitable for smaller buildings or individual users | Growing awareness of health risks associated with poor indoor air quality | Regulatory changes and standards may impact market demand |
Suitable for various types of buildings (residential, commercial, industrial, healthcare) | Limited brand recognition compared to competitors | Expansion into new markets and industries | Economic downturns or market instability may affect sales |
|
| Strategic partnerships and collaborations (with companies/influencers/brands) | Rapid technological advancements and changing customer preferences |
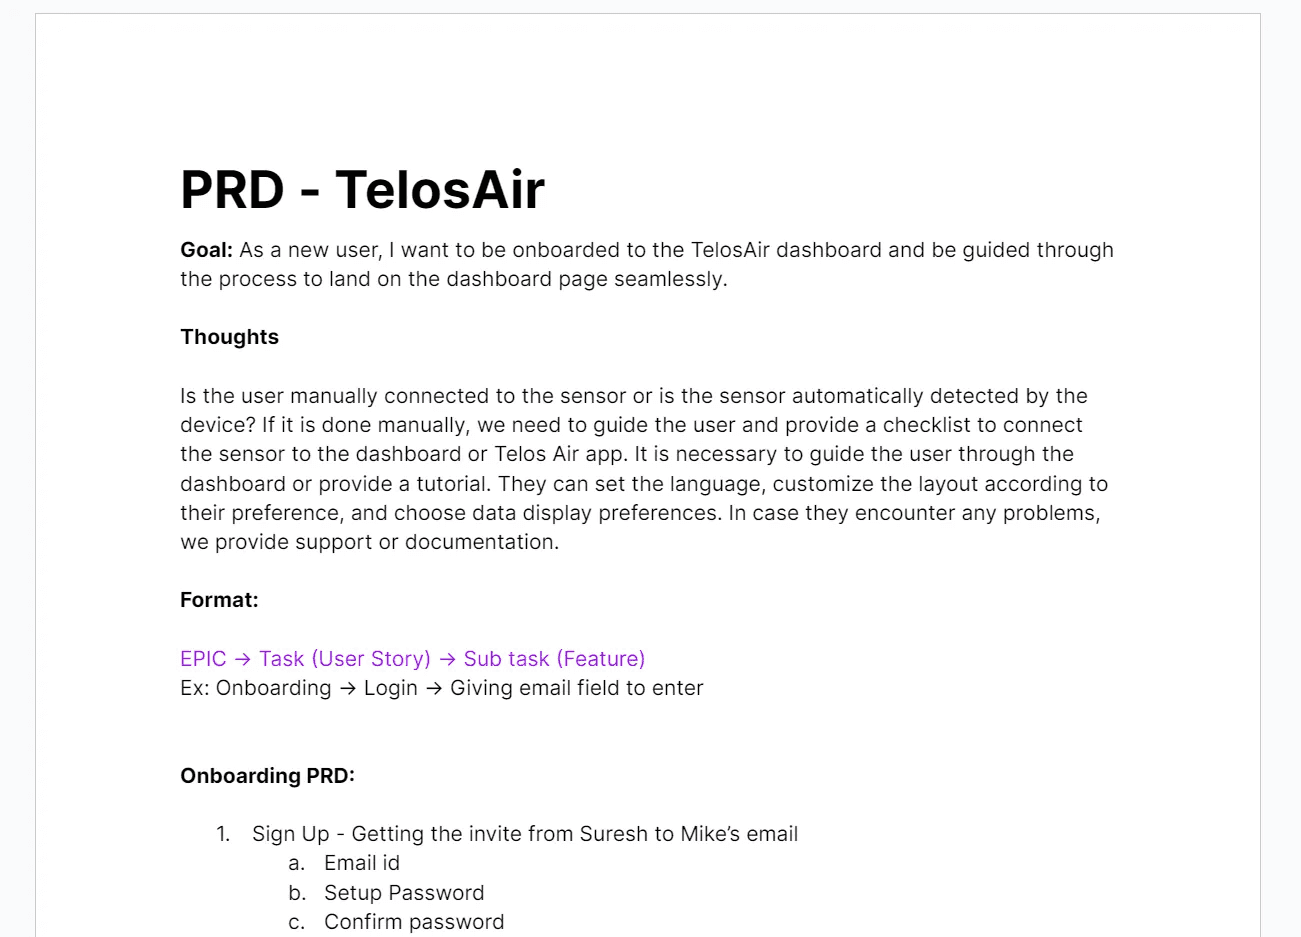
With all the necessary information in hand, I moved from the research phase to the design and exploration phase. As a designer and product enthusiast, I created a Product Requirements Document (PRD). My PRD follows a unique format that includes tasks, user stories, and user flows based on insights and identified problems.
NOTE: My PRD helps us analyze user steps with key features, sub-features, and user flow guidance, ensuring a comprehensive approach to product design.
Solutions
EXPLORATION OF USER JOURNEY →
Now, the most awaited phase has begun, and every startup founder is eager to see the visuals. They’re less interested in the research and more focused on the tangible results:
Bro show me the visuals, not the research! 🤯 → Every* Founders desire
USERSFLOW →
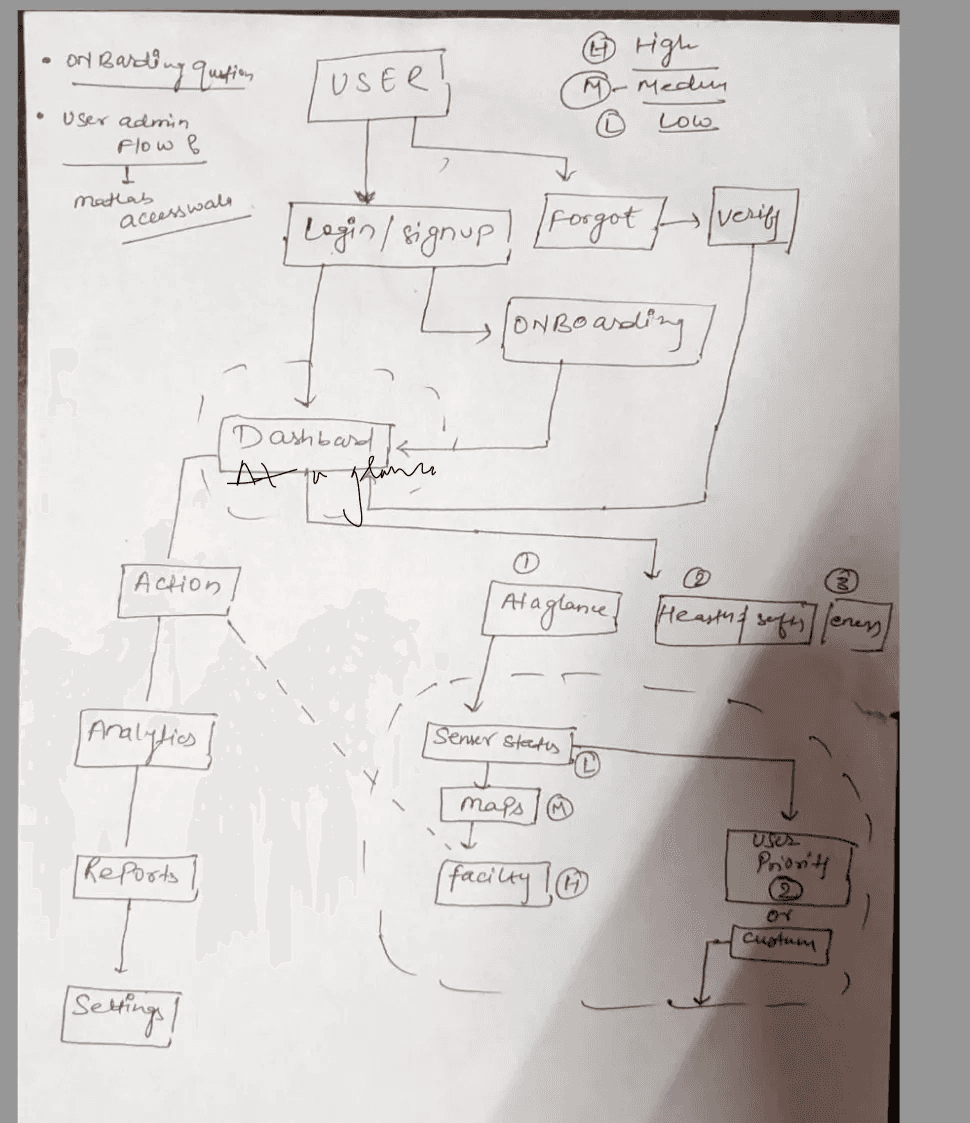
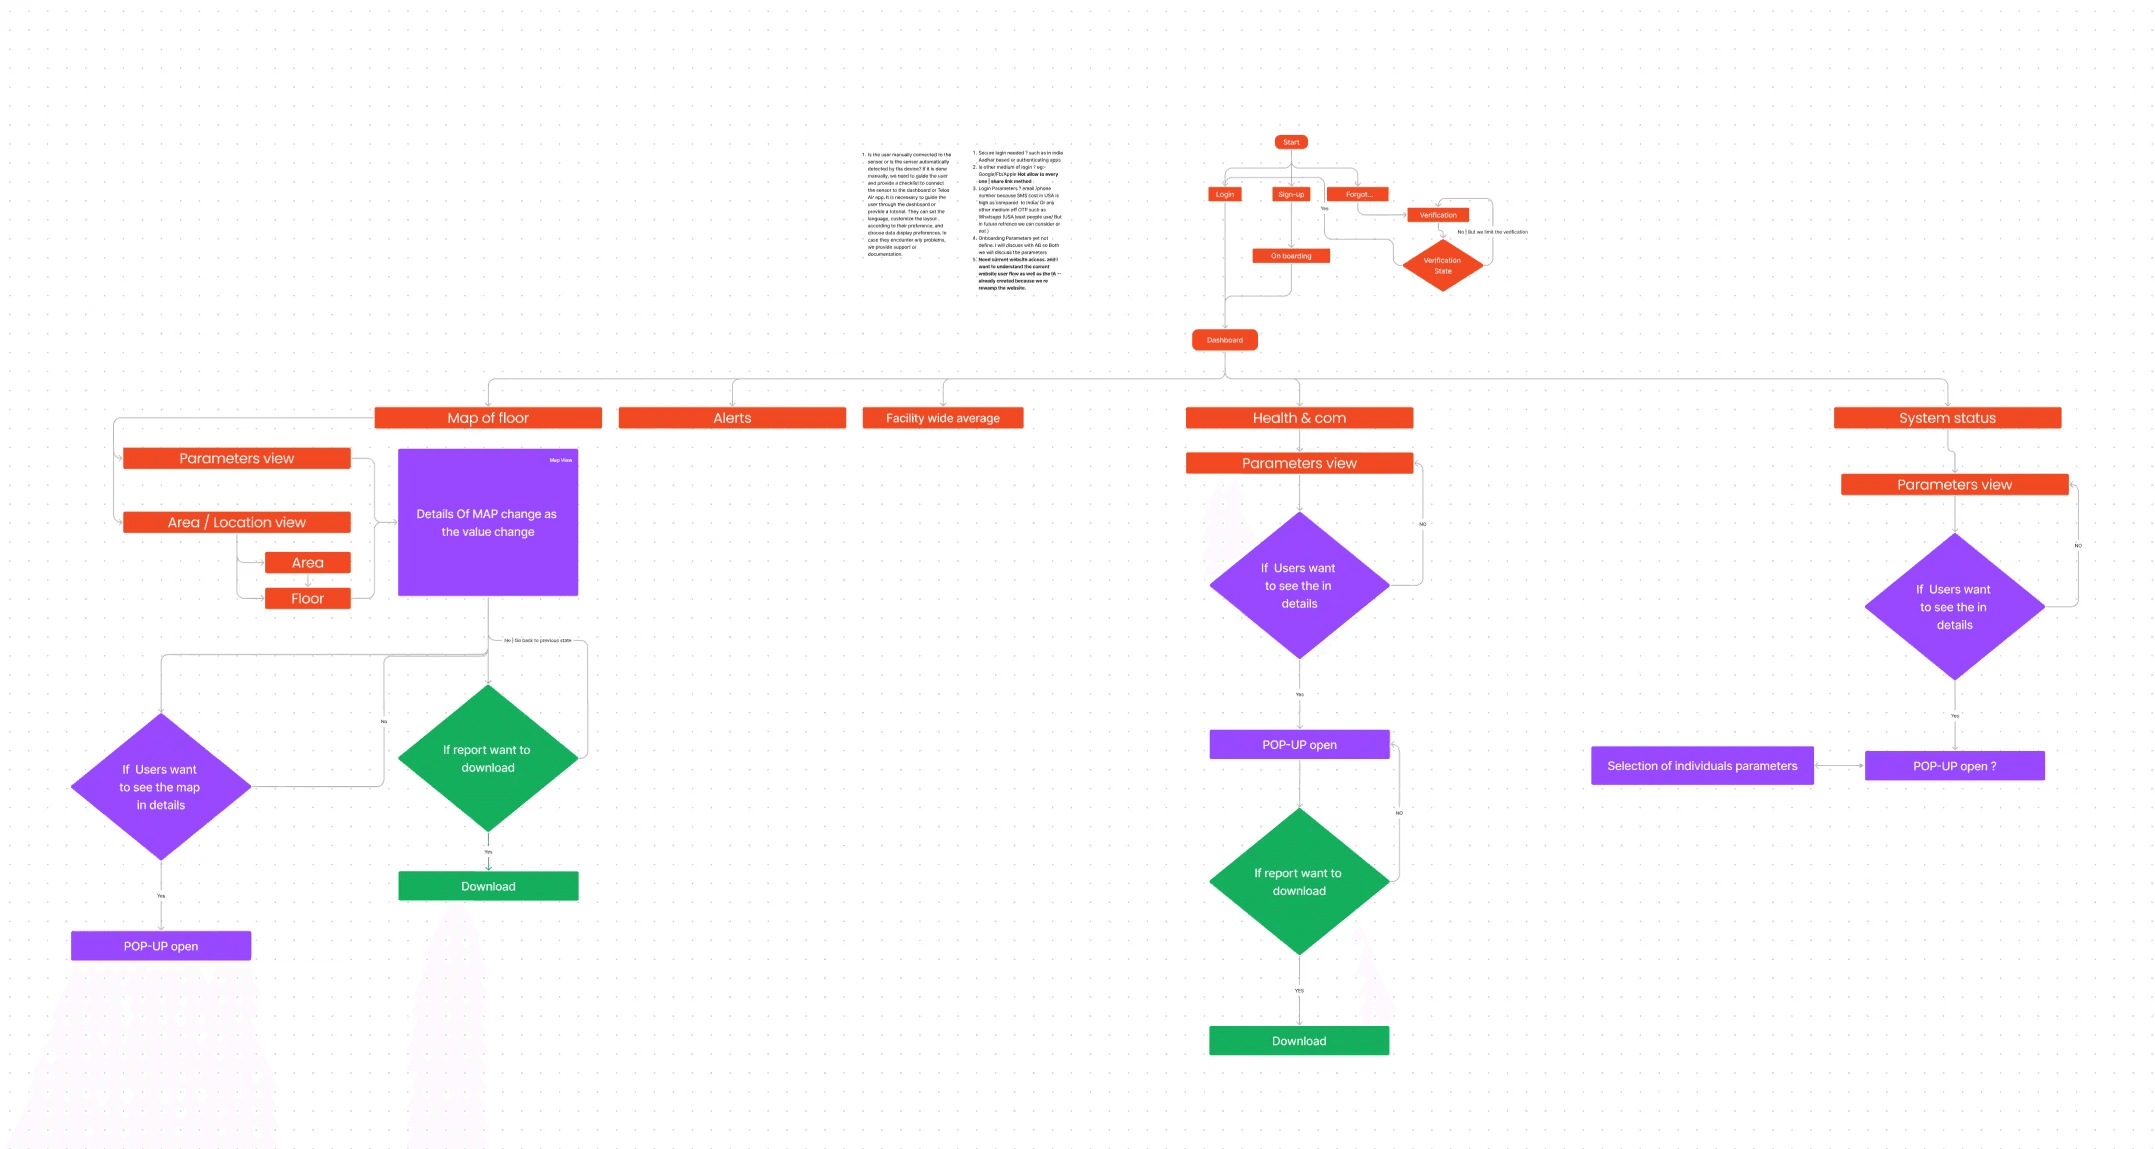
I began creating user flow explorations based on the PRD to streamline and minimize the steps taken by users. By prioritizing simplicity and usability, I designed a user-friendly flow that is easy to access. This user-centric approach helps reduce cognitive load, ensuring a seamless experience for our users.
🔴Below are the exploration of user flow on paper and the final user flow on Figjam
THE VISUAL PHASE →
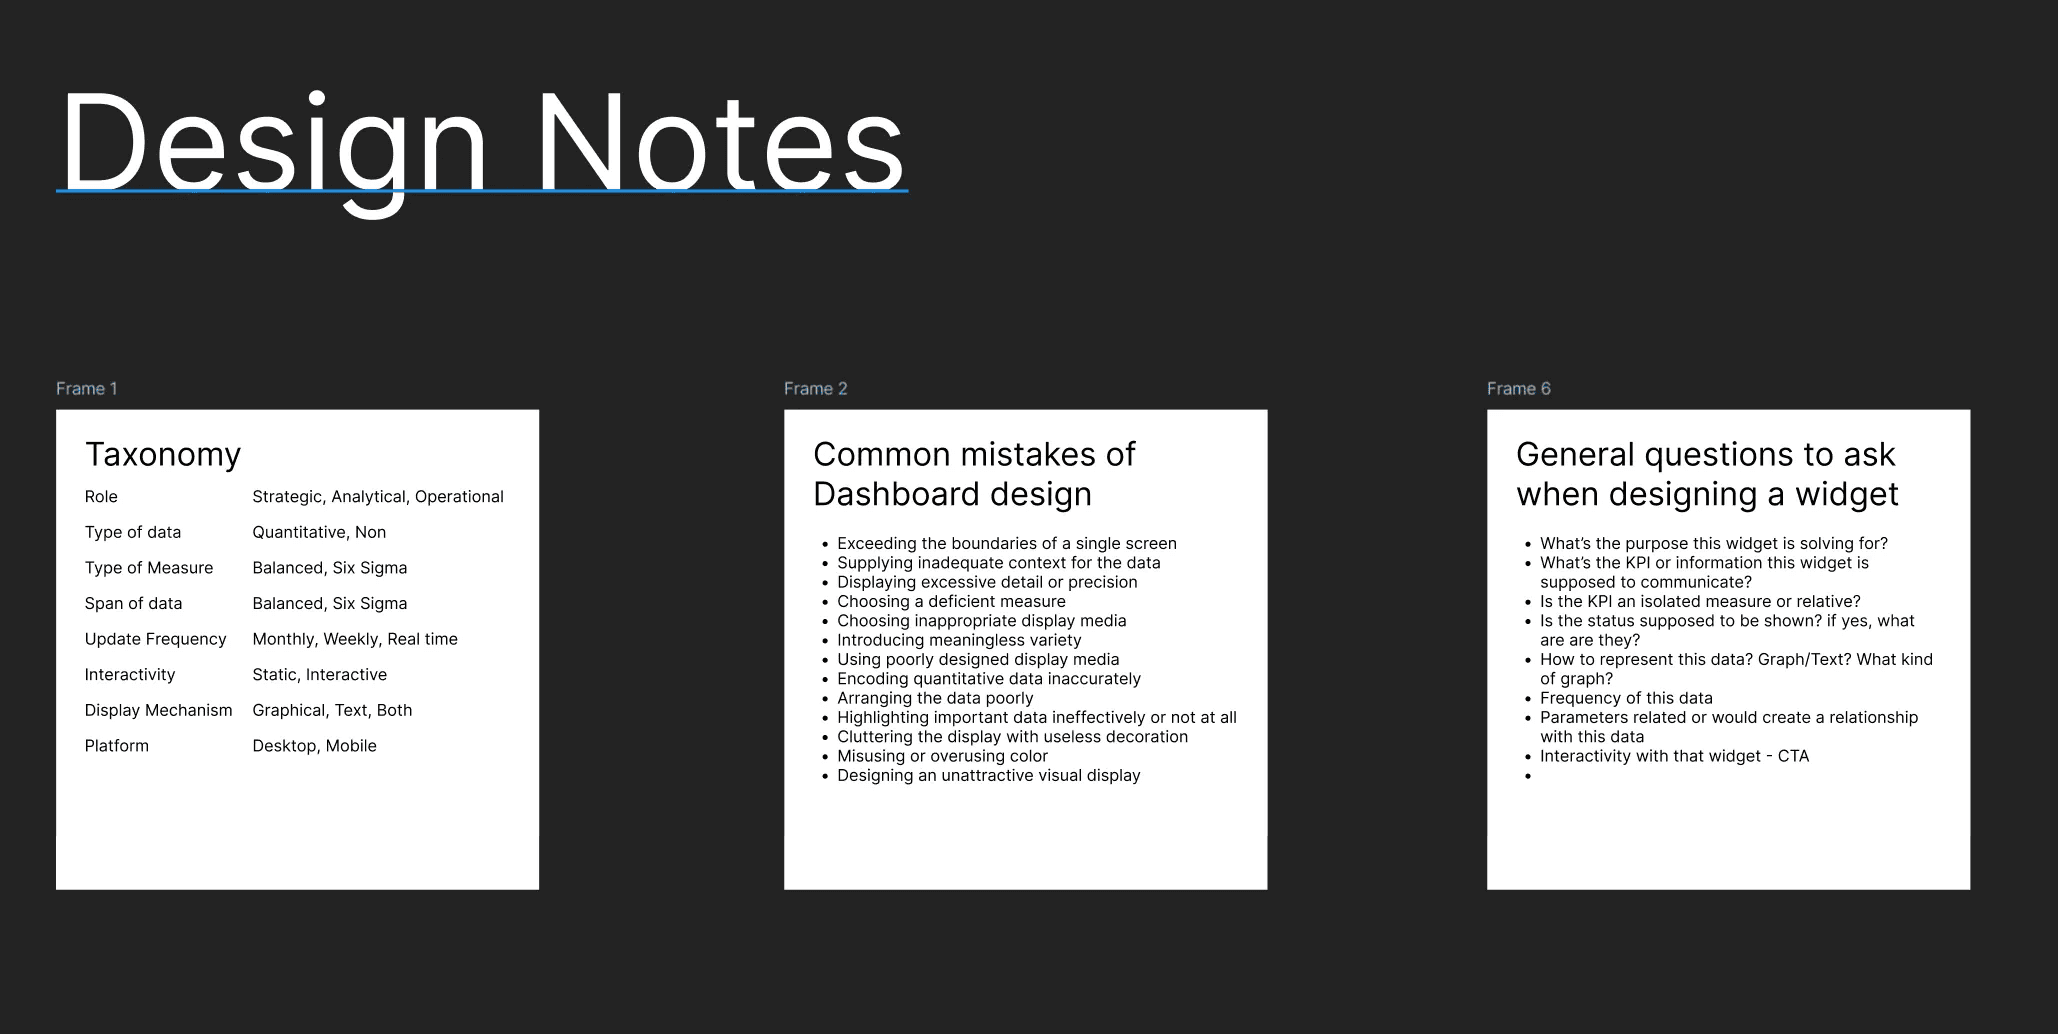
By adhering to my design process and strategy, I created a note to remind myself of key principles whenever I design an HVAC dashboard for TelosAir products. You can see my strategy below.
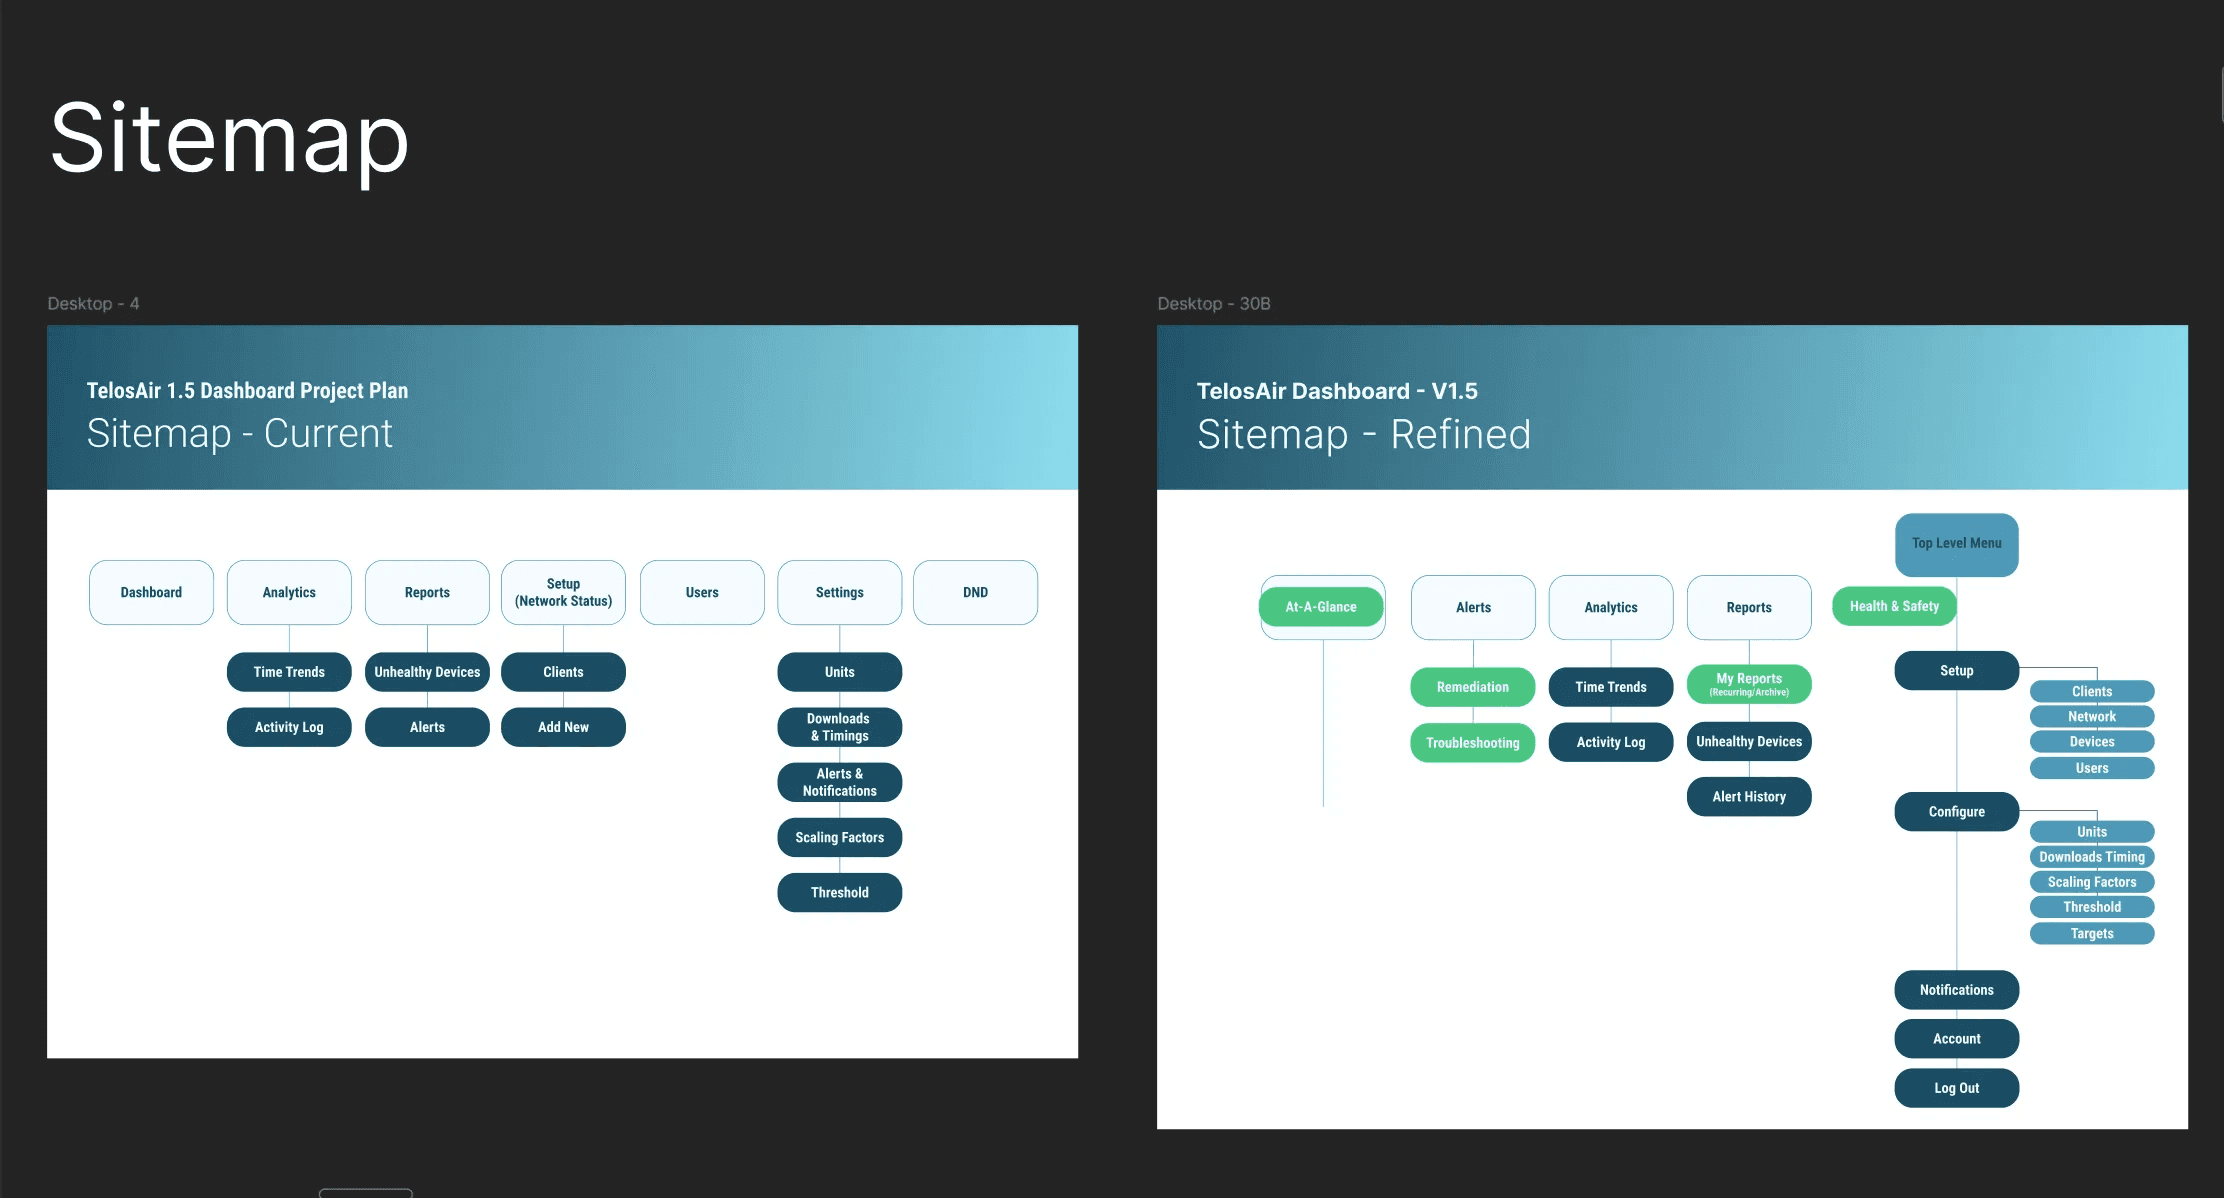
OLD VS NEW SITEMAP →
After completing all the research, I refined the sitemap. You can check the image below to see the old sitemap V/S the new sitemap. I focused on categorizing items into groups to enhance user experience and improve SEO performance. This structured approach helps the product achieve better rankings in search engines.
VALIDATING SOLUTION→
I began validating the best possible solutions, using a trial-and-error approach to achieve the desired outcomes for the appropriate problems in the TelosAir product redesign. My primary focus was on functionality, layout, and the positioning of features. I used the Z-pattern map identified in my initial research to ensure optimal usability. Below, you can see the key aspects of this validation process.
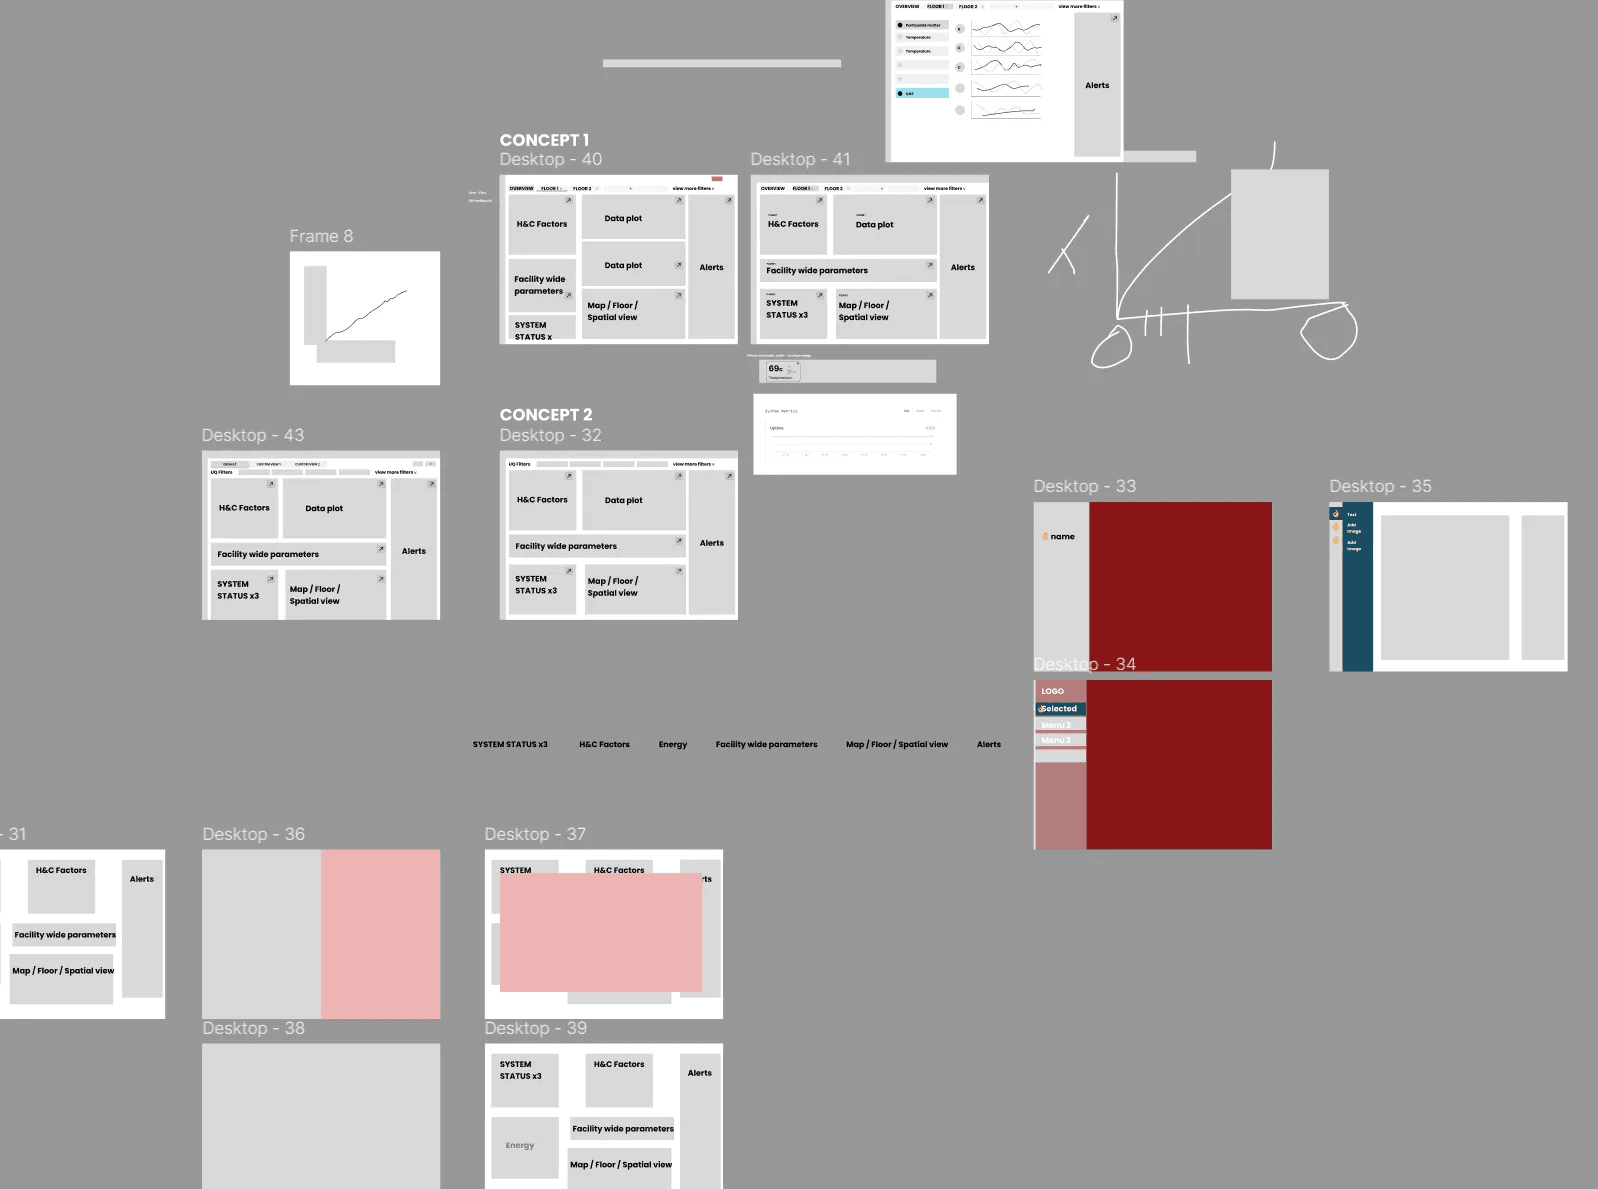
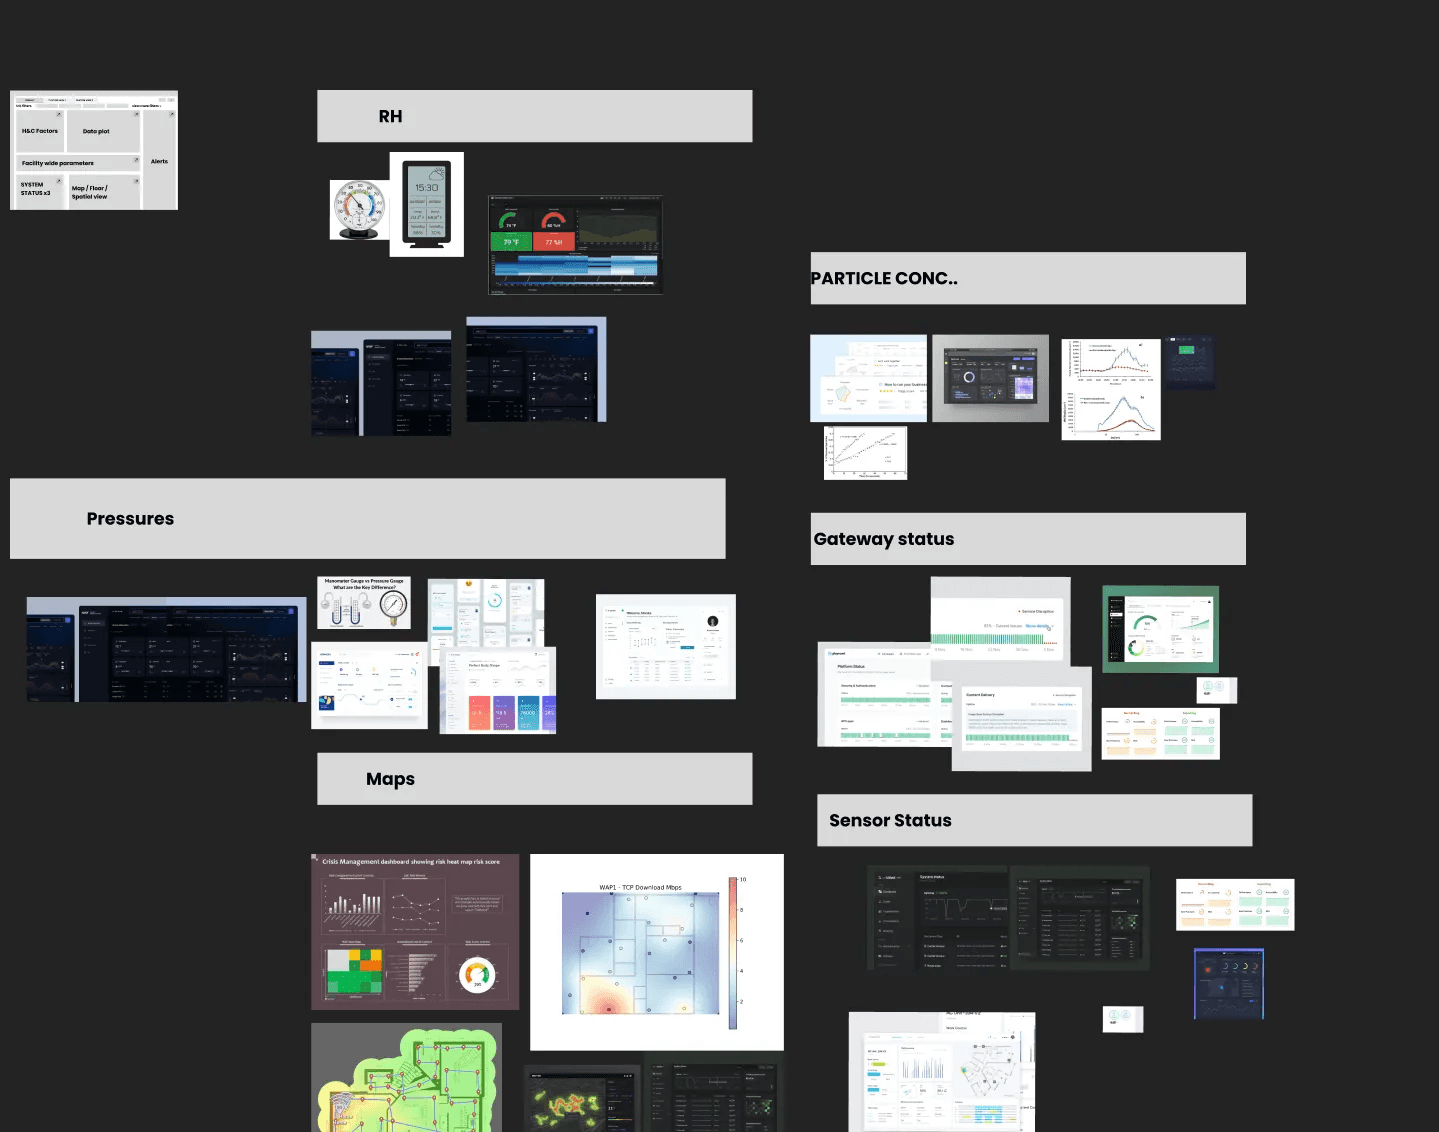
MOODBOARD EXPLORATION →
I began collecting mood boards for various widgets, aiming to cover five different samples for each widget. Using these mood boards, I defined the best data-driven analytic use cases. This process helped in creating effective wireframes for the HVAC dashboard design.
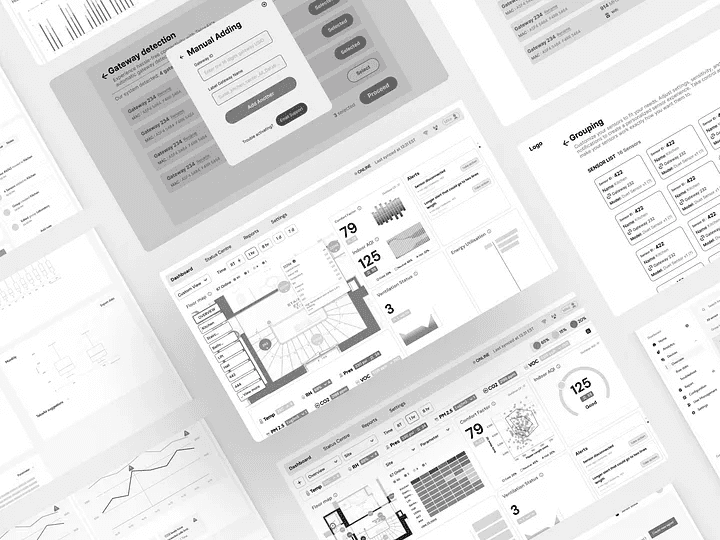
WIREFRAME →
And finally 🥳, I created the Hi-Fi (high-fidelity) wireframe. My style of Hi-Fi wireframes includes everything in black and white, with actual brand colours incorporated. I applied every aspect of product design, adding details like UX copywriting to the wireframe. My goal was to create an intuitive wireframe so that when I handed it over to the UI designer, they only needed to fill in the colours without much additional work. Below are samples of my style of wireframes.
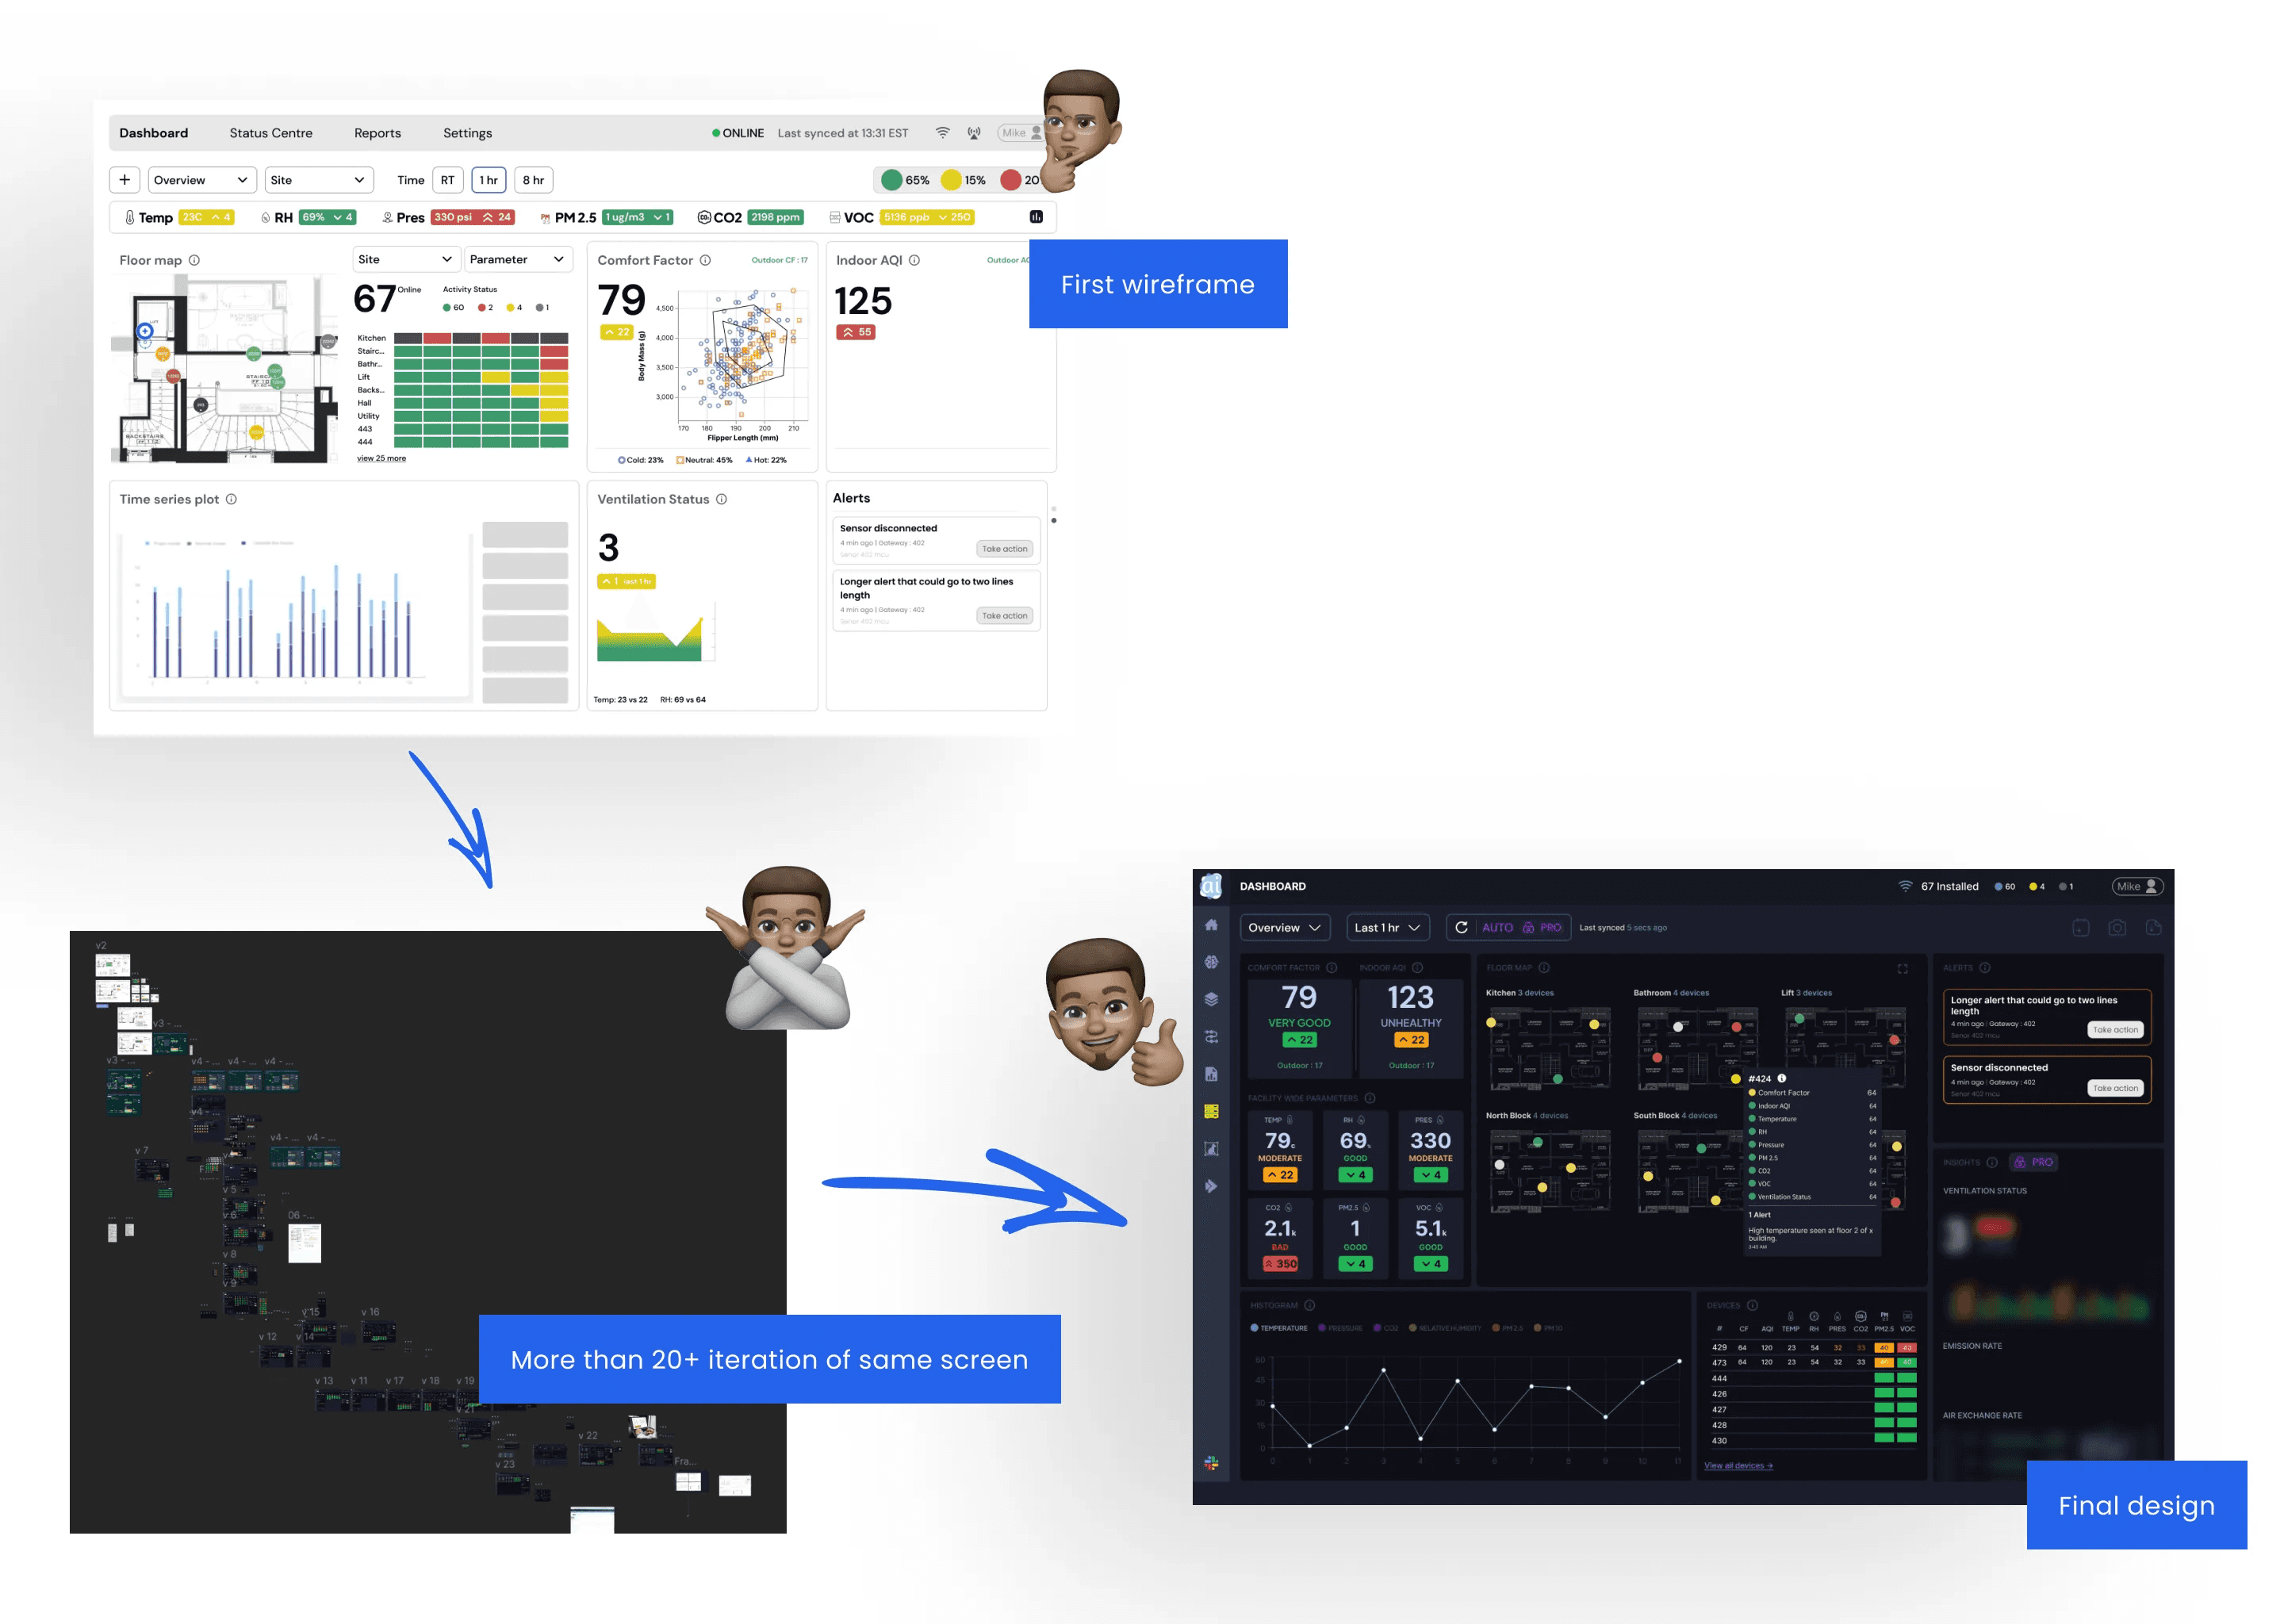
ITERATION →
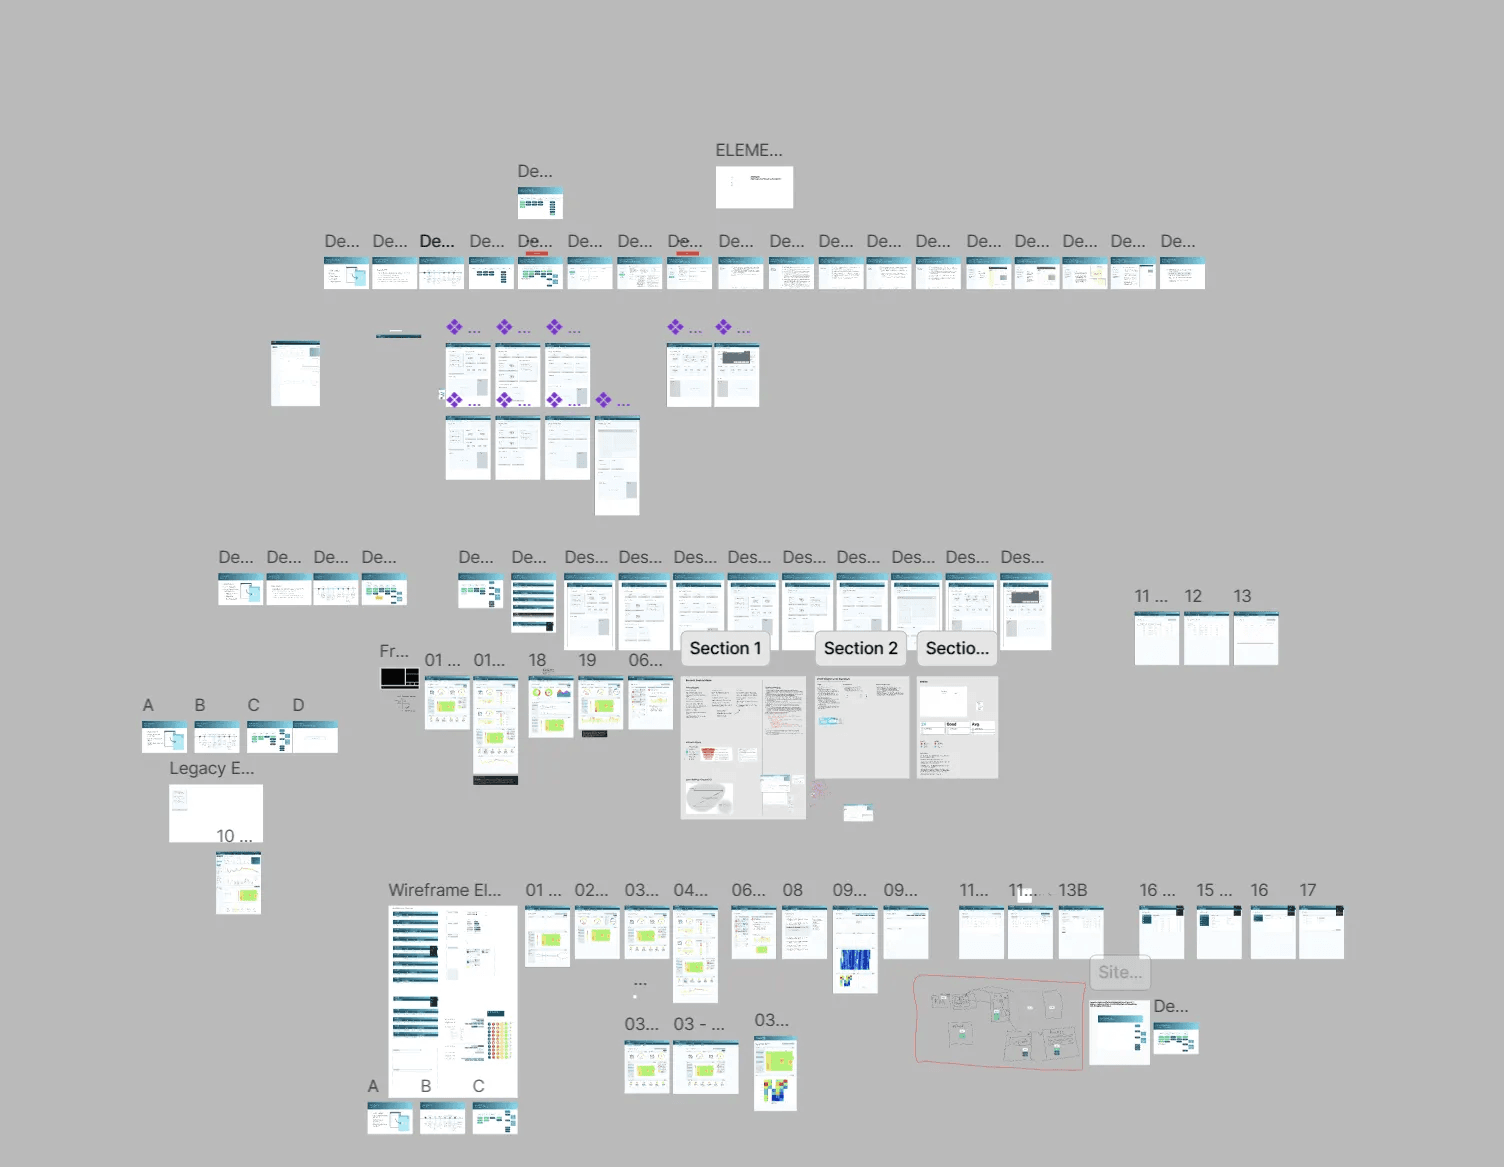
Iteration is a constant in a designer’s life, and like all of us, I had to iterate based on stakeholder feedback. I went through over 20 iterations of the home screen before reaching the final result. You can check the before and after screens and the in-between iterations in the image below.
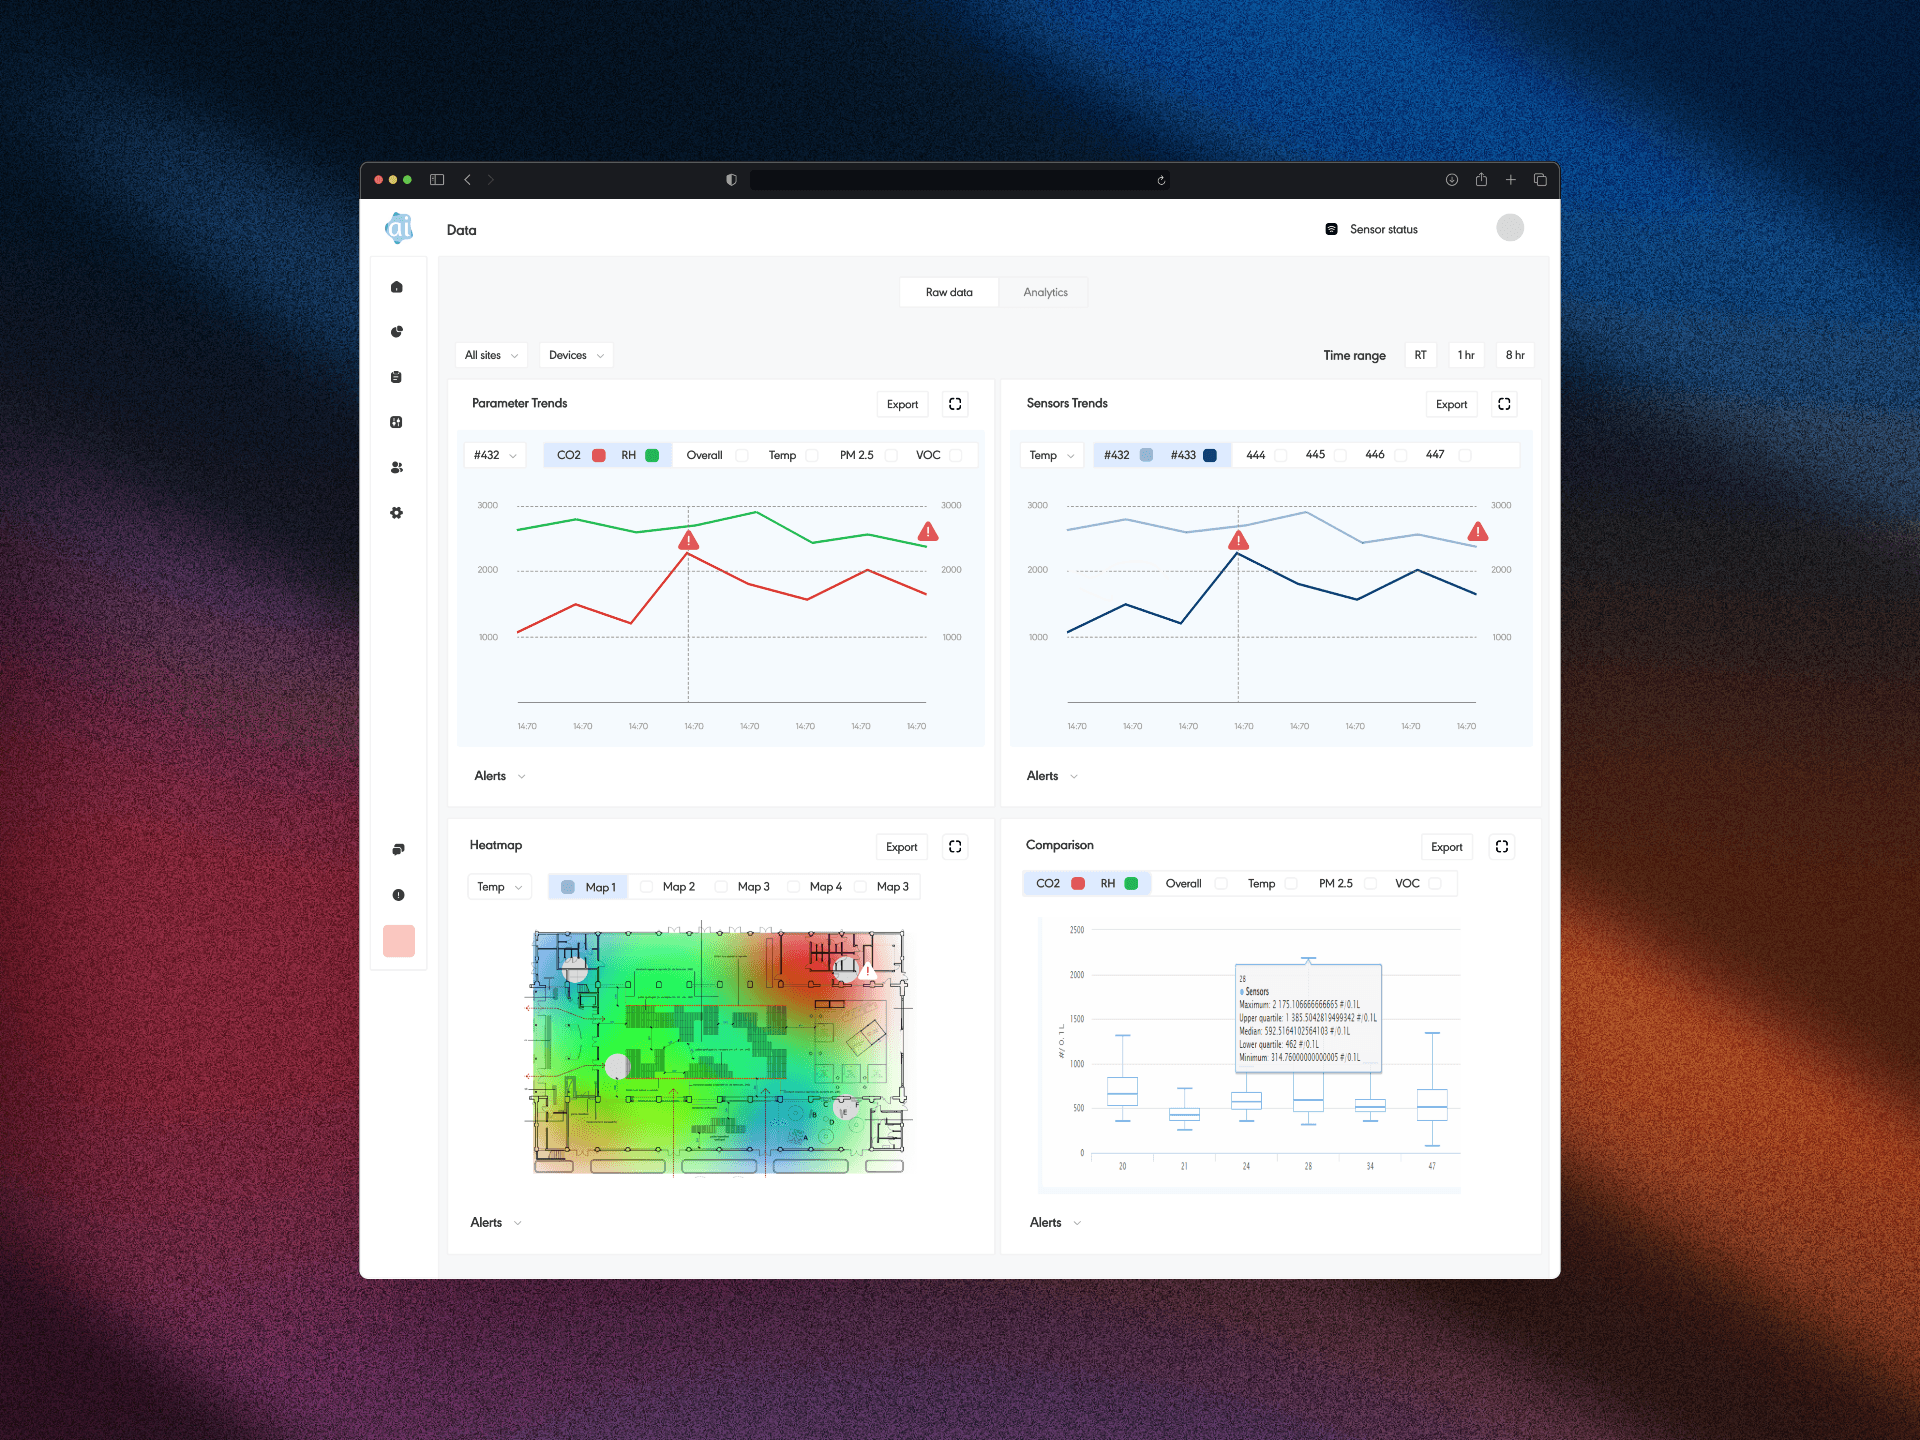
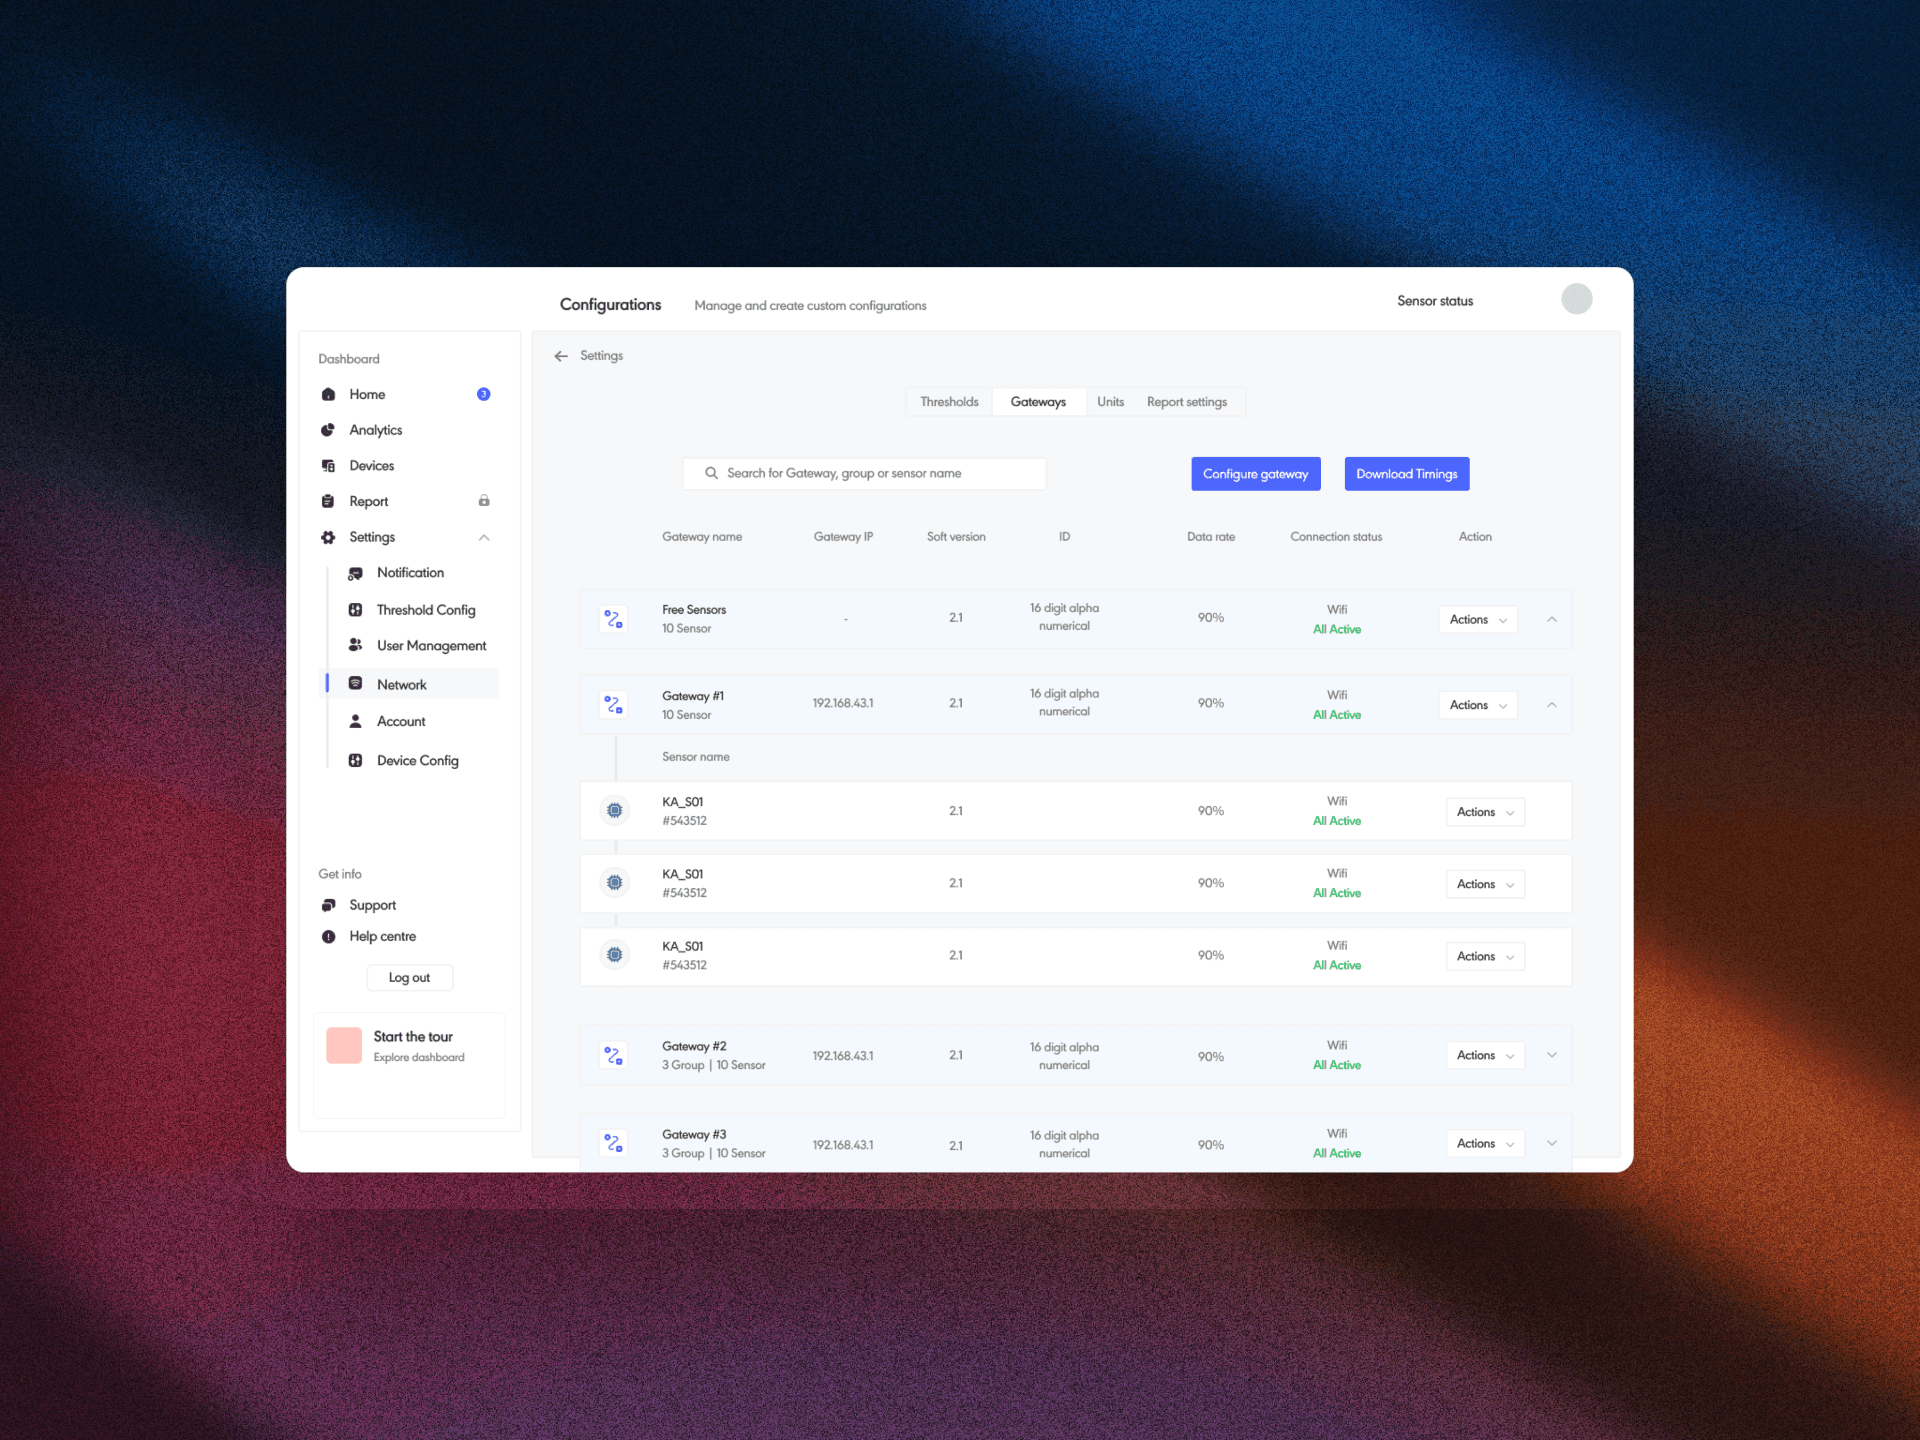
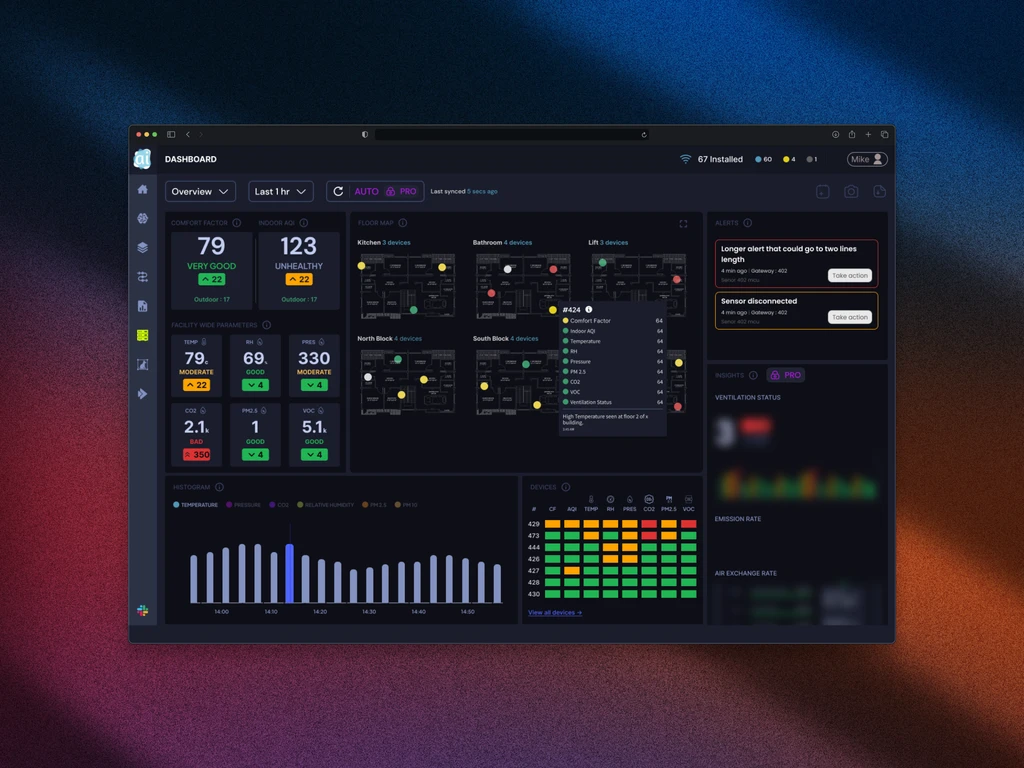
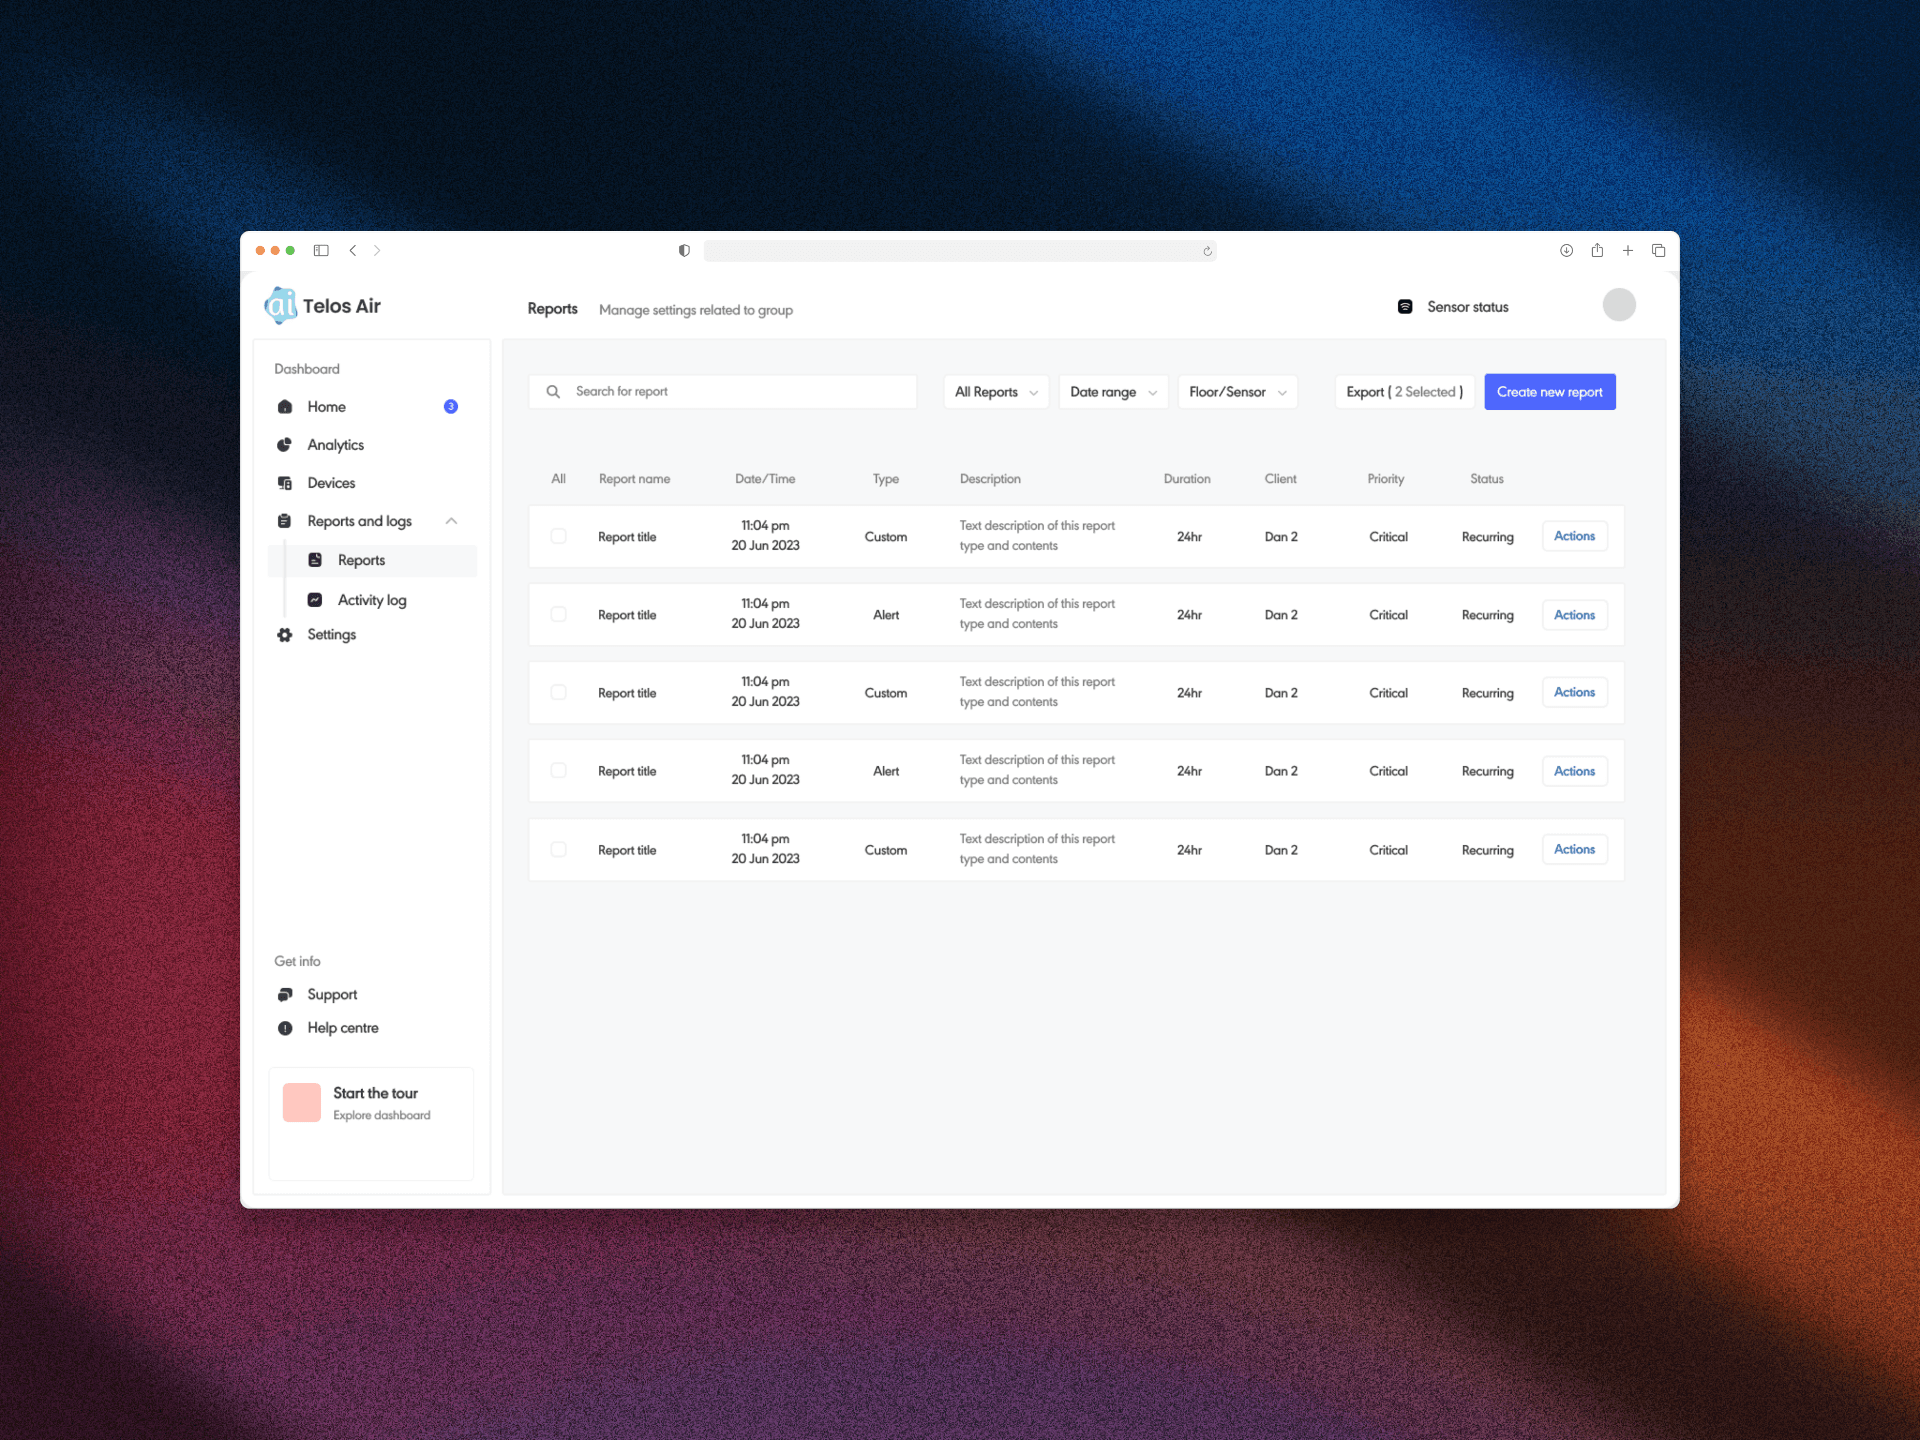
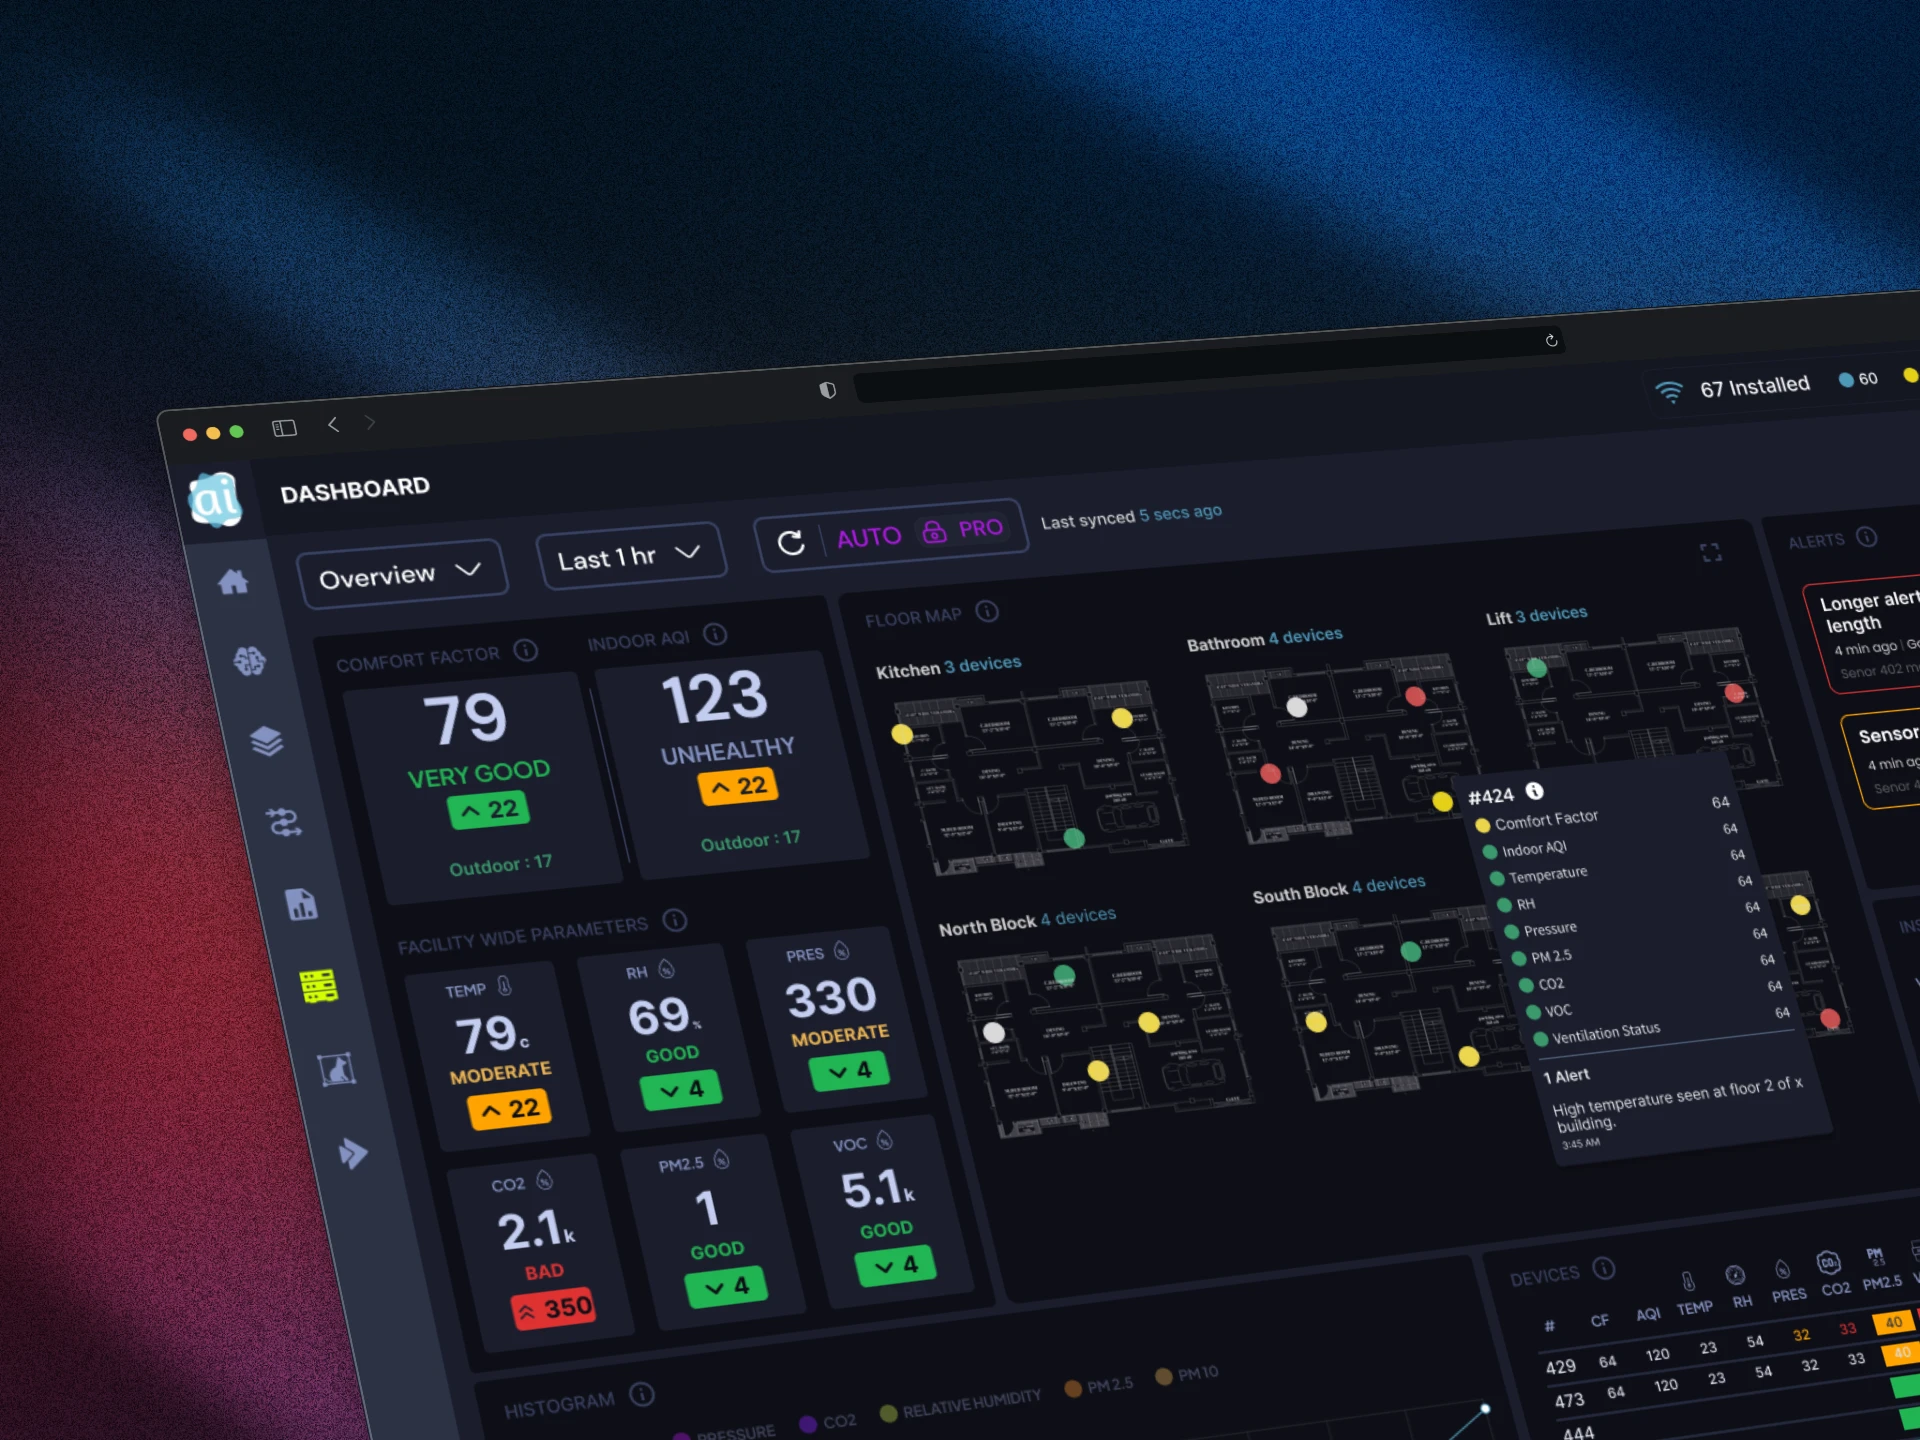
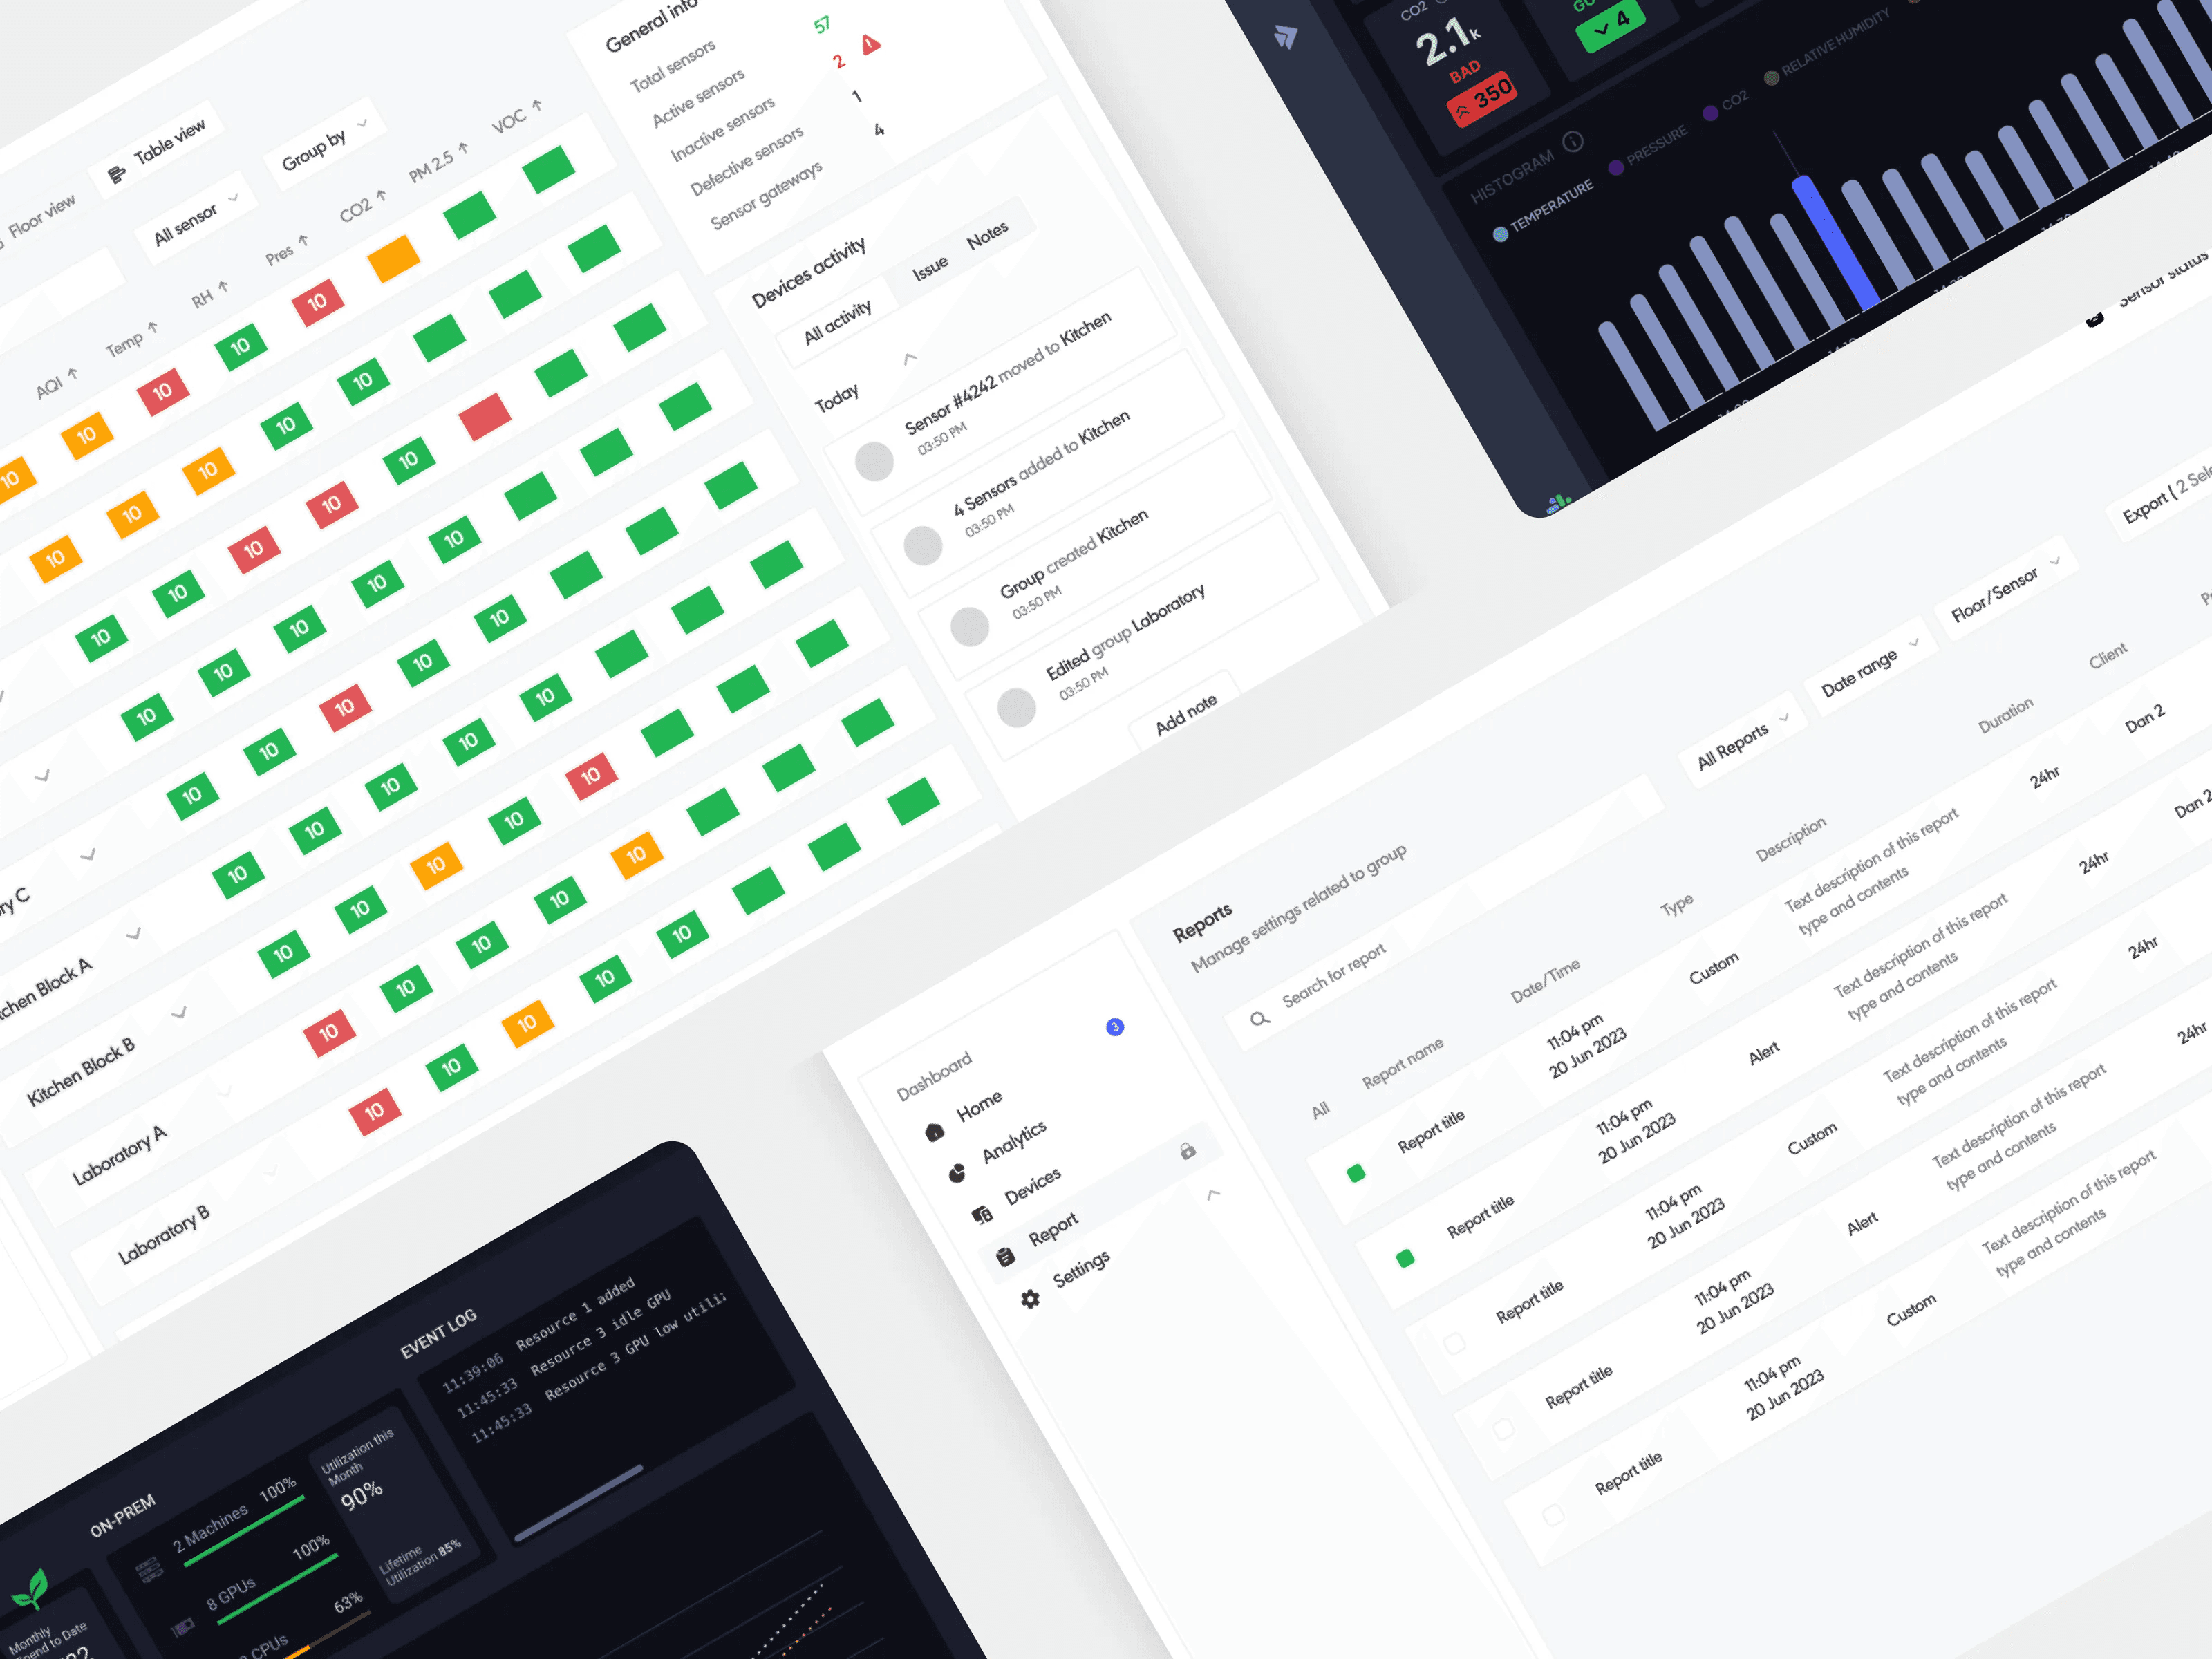
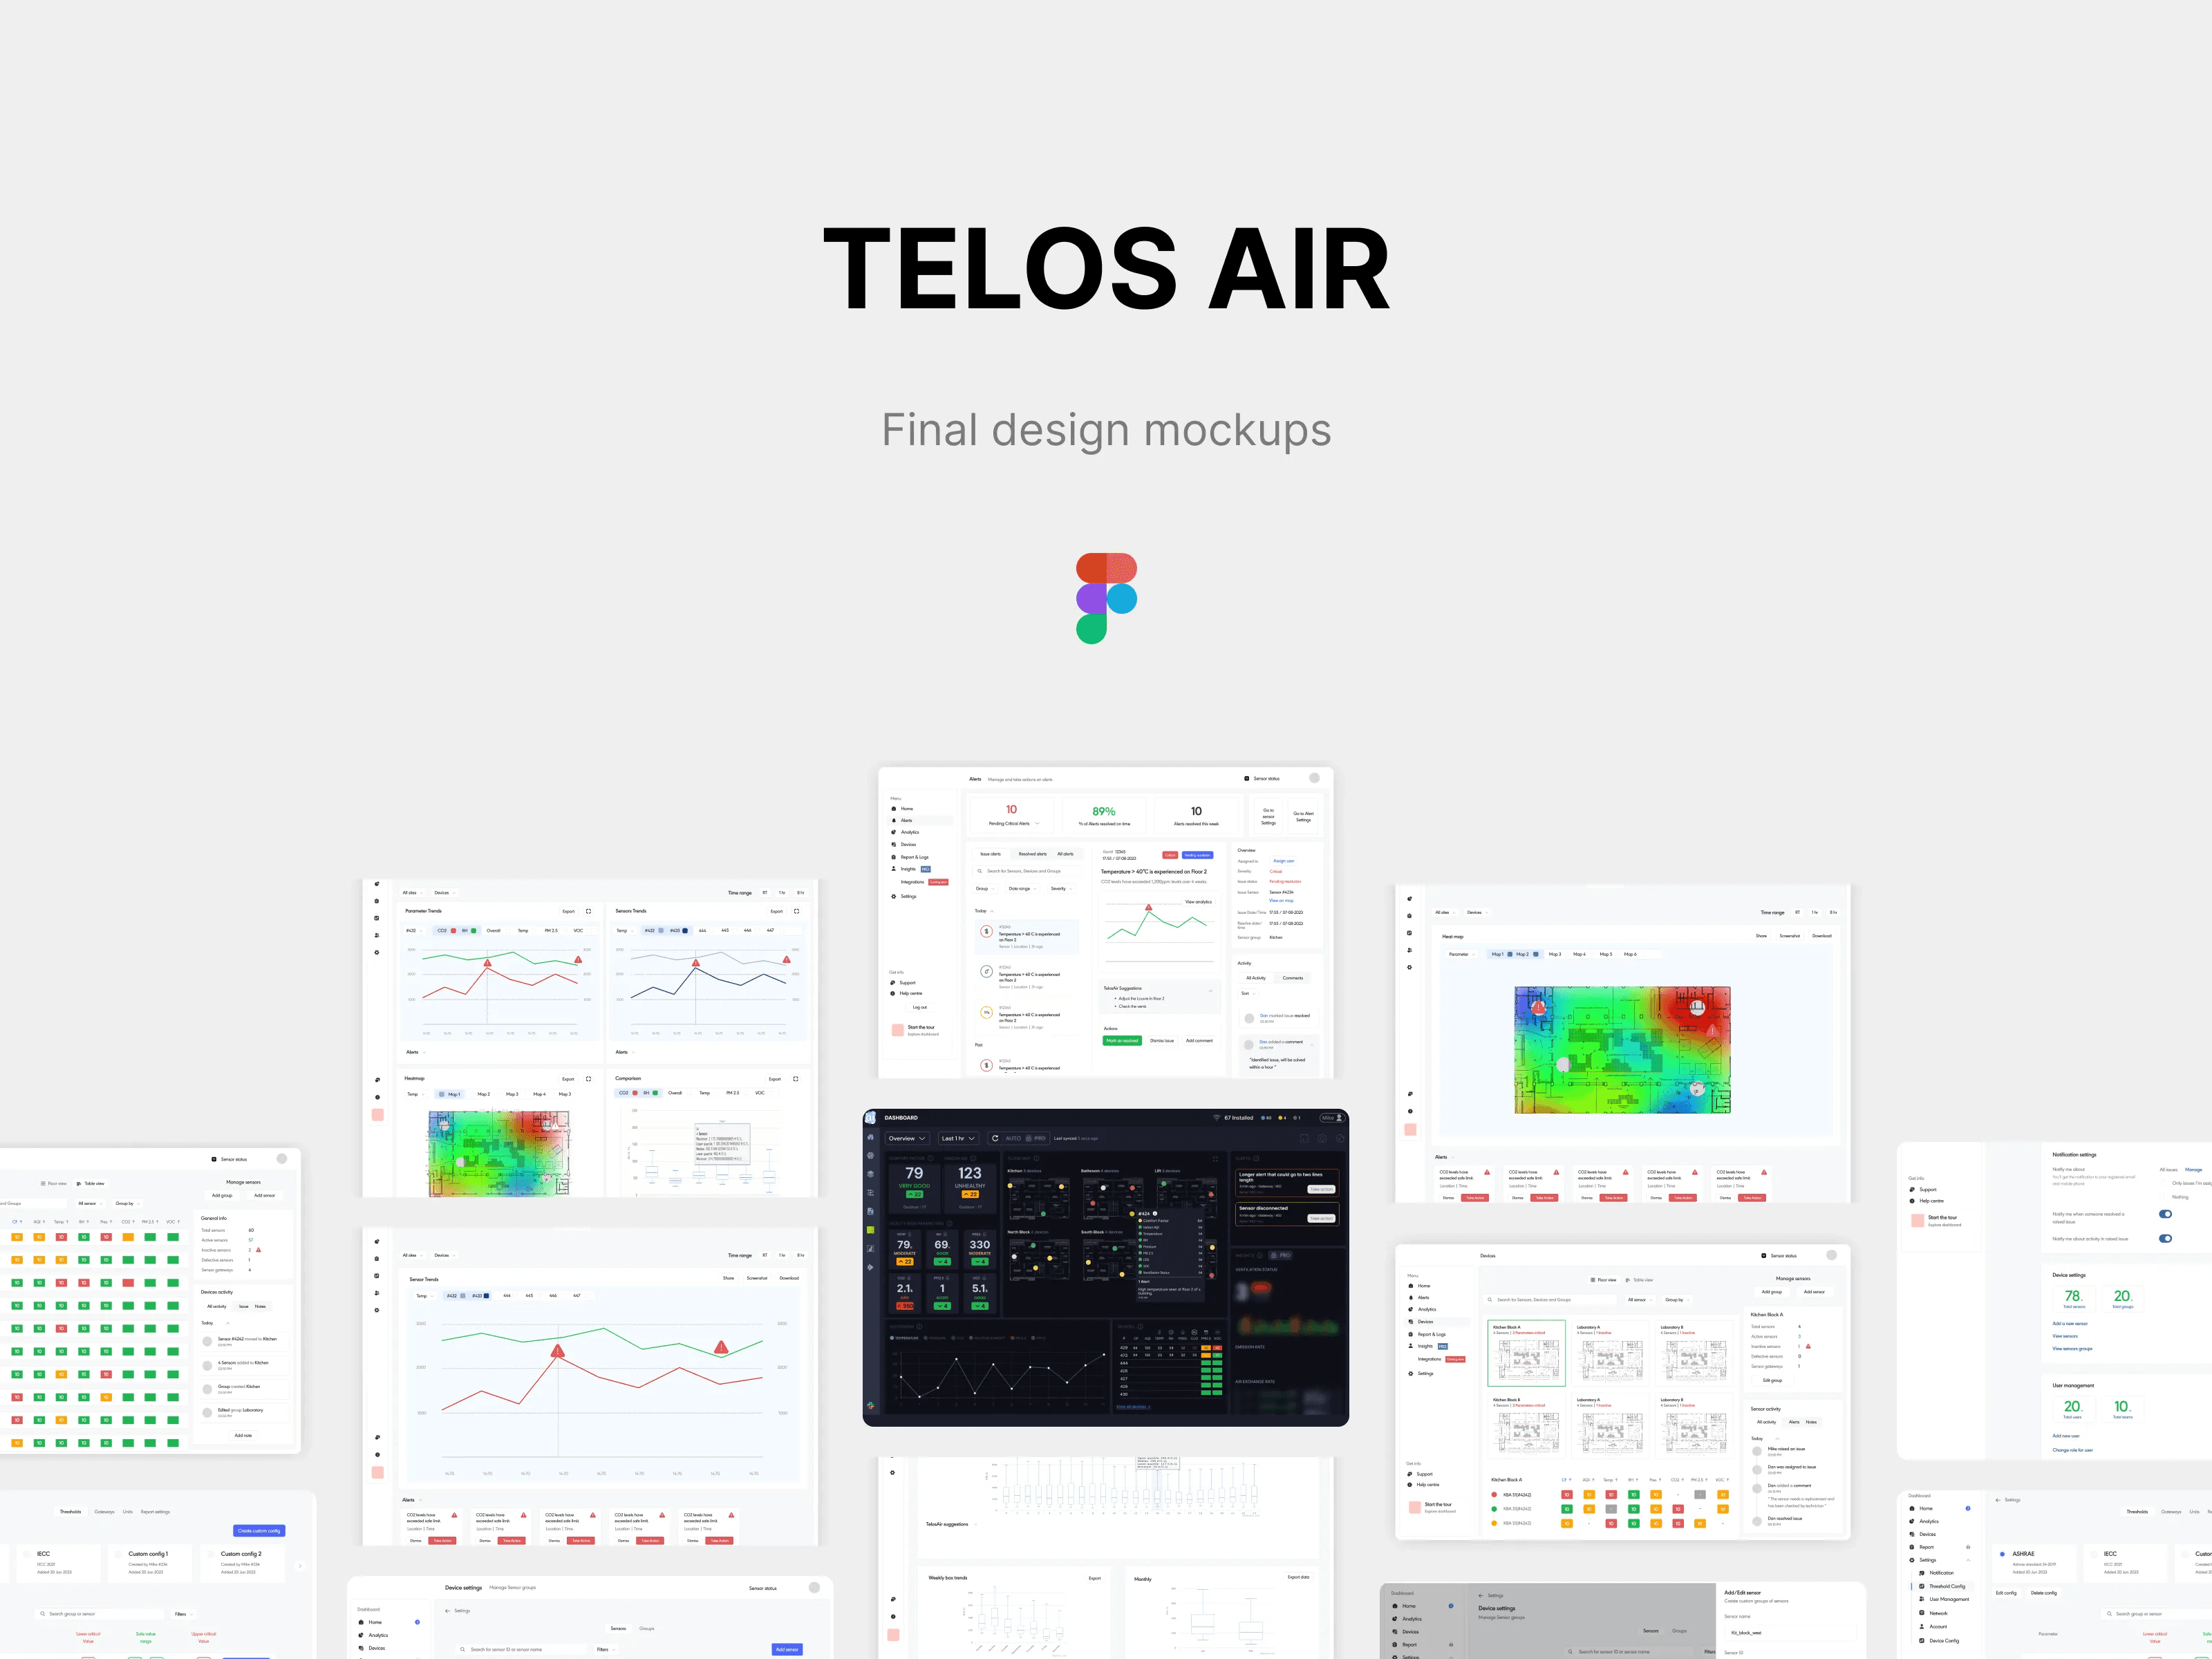
FINAL MOCKUPS →
After completing all these steps, the day finally came to revamp the entire product screen. Within two months, I delivered the product to the stakeholders. I was excited and proud to have completed the project successfully.
Business Outcome
Previously, I struggled with constant refreshes and an overwhelming interface, but the redesign has changed all that. The new dashboard is smooth and responsive, and I love the custom widgets.
Michael R — Building Operations Supervisor
Quantitative data also demonstrated the impact of the redesign:
Customer Retention Rate (Customer retention rate)
Old 50%
New 72 %
Impact 22% Period 6 MonthsTask Completion Time for Sensor Comparison
Old 15.2-sec avg
New 8.5 sec
Impact 44% drop → GoodUser growth rate
Old 5%
New 8%
Impact 3%
Learning and next steps
Yes, I made it! I delivered the project and received positive feedback from stakeholders and founders about the redesign. Throughout this redesign process, I learned many valuable things, such as:
Dashboard design principles
Insights about HVAC systems
I am thankful to the founders who trusted me to work on this project and to Anudeep Sir, who mentored me and helped me create the product.
If you liked this case study, please share it with your designer friends and founders. Comment on what you liked and what I can improve.
Also, hit the clap button!
If you have any projects, feel free to
Contact me: wrk.sumit@gmail.com