2025
Outbox Labs
saasmetrics.ai

Background
As the product designer at SaaSMetrics, I led the design of a revolutionary SaaS analytics platform from concept to MVP launch. This case study details our journey of transforming complex financial data into actionable insights through intuitive design.
SaaSMetrics is a data-driven analytics platform designed to empower SaaS businesses with actionable financial insights. The project addresses a common pain point for SaaS founders, CXOs, and solopreneurs: the challenge of consolidating subscription data, understanding customer behavior, and making informed decisions in a fast-paced digital environment.
Implementation & Timeline
Phase | Date | Status |
|---|---|---|
Leadership Approval | 08/12/2024 | Completed |
Design Completion | 26/1/2025 | Completed |
Prototype Testing | 23/2/2025 | Completed |
MVP Launch | 10/03/2025 | Completed |
Core problem
SaaS businesses today encounter several fundamental challenges that hinder growth and decision-making.
Key business data is scattered across multiple platforms (e.g., payment processors, CRM, analytics tools), making it difficult to gain a unified view.
Many teams struggle to interpret and act on complex SaaS metrics, leading to confusion and missed insights.
The absence of automated reporting systems results in time-consuming, manual processes for tracking and sharing performance data.
Without up-to-date analytics, businesses are forced to make decisions based on outdated or incomplete informatio
Show the data:
73% of SaaS businesses struggle with scattered data across multiple platforms
89% report difficulties in interpreting complex SaaS metrics
62% lack automated reporting systems
91% need real-time insights for decision-making
Research and Analysis
Market Research
Surveyed 500+ SaaS businesses to understand pain points and needs.
Conducted 15 in-depth user interviews.
Analyzed 15 competitor products to benchmark features and gaps.
Competitive Analysis
Product | Core Focus | Strengths | Areas of Improvement | Pricing / Positioning |
SaaSMetrics | Real-time SaaS metrics dashboard, subscription analytics, benchmarking, automated reports, segmentation, payment recovery automation, trial insights, customer profiles, campaign automation | Unified dashboard, automation, customer segmentation, payment recovery, actionable insights, easy onboarding, customizable reports, campaign center | New entrant, feature depth still evolving, market awareness phase | Tiered (Starter, Business, Enterprise), Free trial, Lifetime deal available |
Baremetrics | Subscription analytics, benchmarking, customer segmentation, cancellation insights, payment recovery | User-friendly, deep SaaS metrics, actionable benchmarking, customer research tools, automation, SOC 2 compliance | Steep pricing, learning curve, limited non-subscription metrics | Premium, may be expensive for startups |
ChartMogul | Subscription analytics (MRR, churn), cohort analysis, segmentation | Strong subscription focus, clean UI, integrations | Limited outside subscription businesses, less customizable reporting | Subscription-based, mid-market |
Mixpanel | Product analytics, user behavior tracking, funnel analysis, segmentation | Deep event tracking, flexible analytics, real-time data | Not SaaS-focused, complex setup for non-technical users | Usage-based, scales with data volume |
Google Analytics | Web/app analytics, user behavior, conversion tracking | Free, industry standard, robust reporting | Not SaaS-specific, lacks subscription and financial metrics | Free (GA4), Premium for enterprise |
Hotjar | UX analytics, heatmaps, session recordings, feedback | Visual insights, easy to use, great for UX research | Not financial/SaaS metrics, limited quantitative analysis | Subscription-based |
Tableau | Data visualization, dashboard creation, business intelligence | Powerful visualizations, integration flexibility | Expensive, steep learning curve, not SaaS-focused | Premium, enterprise |
Domo | Business intelligence, KPI dashboards, data integration | All-in-one BI, strong integrations, scalable | High cost, can be complex, not SaaS-specific | Premium, enterprise |
Looker | Data exploration, custom reporting, BI | Customizable, real-time data, strong for large teams | Requires technical expertise, high cost, not SaaS-focused | Premium, enterprise |
Zoho Analytics | Online BI, reporting, dashboards | Affordable, easy to use, broad integrations | Limited depth for SaaS metrics, less advanced analytics | Affordable, SMB focus |
SAP BusinessObjects | Enterprise BI, reporting, data analysis | Enterprise-grade, robust security | Complex, expensive, overkill for SMBs, not SaaS-focused | Enterprise |
Heap Analytics | Auto-capture of user interactions, product analytics | No manual event setup, easy onboarding | Not SaaS-specific, limited financial reporting | Subscription-based |
Qlik Sense | Self-service BI, custom dashboards, data discovery | Flexible, strong data discovery | Not SaaS-focused, can be complex for new users | Premium |
Geckoboard | Real-time dashboards for SaaS, KPI tracking | Simple setup, SaaS orientation, team sharing | Basic analytics, limited segmentation/automation | Subscription-based |
Cyfe | All-in-one business dashboards, multi-source tracking | Affordable, broad integrations, all-in-one | Limited SaaS-specific features, basic analytics | Affordable, SMB focus |
Insights
73% of SaaS businesses struggle with scattered data across platforms.89% report difficulties interpreting complex SaaS metrics.62% lack automated reporting systems.91% need real-time insights for decision-making.
Design Process
Imagine a SaaS founder named Priya. Every month, she spends hours pulling data from Stripe, spreadsheets, and analytics tools, trying to understand her company’s growth. She’s frustrated by scattered information, manual reporting, and the constant worry that she’s missing key insights. Priya dreams of a single platform that brings all her metrics together, helps her make faster decisions, and gives her team the clarity they need to grow.
User Personas
SaaS Founders (42%): Want affordable, easy-to-use dashboards for data-driven decisions.
SME CXOs (35%): Seek a holistic understanding of SaaS/Stripe products.
Solopreneurs (23%): Need all-in-one financial solutions for tracking performance.
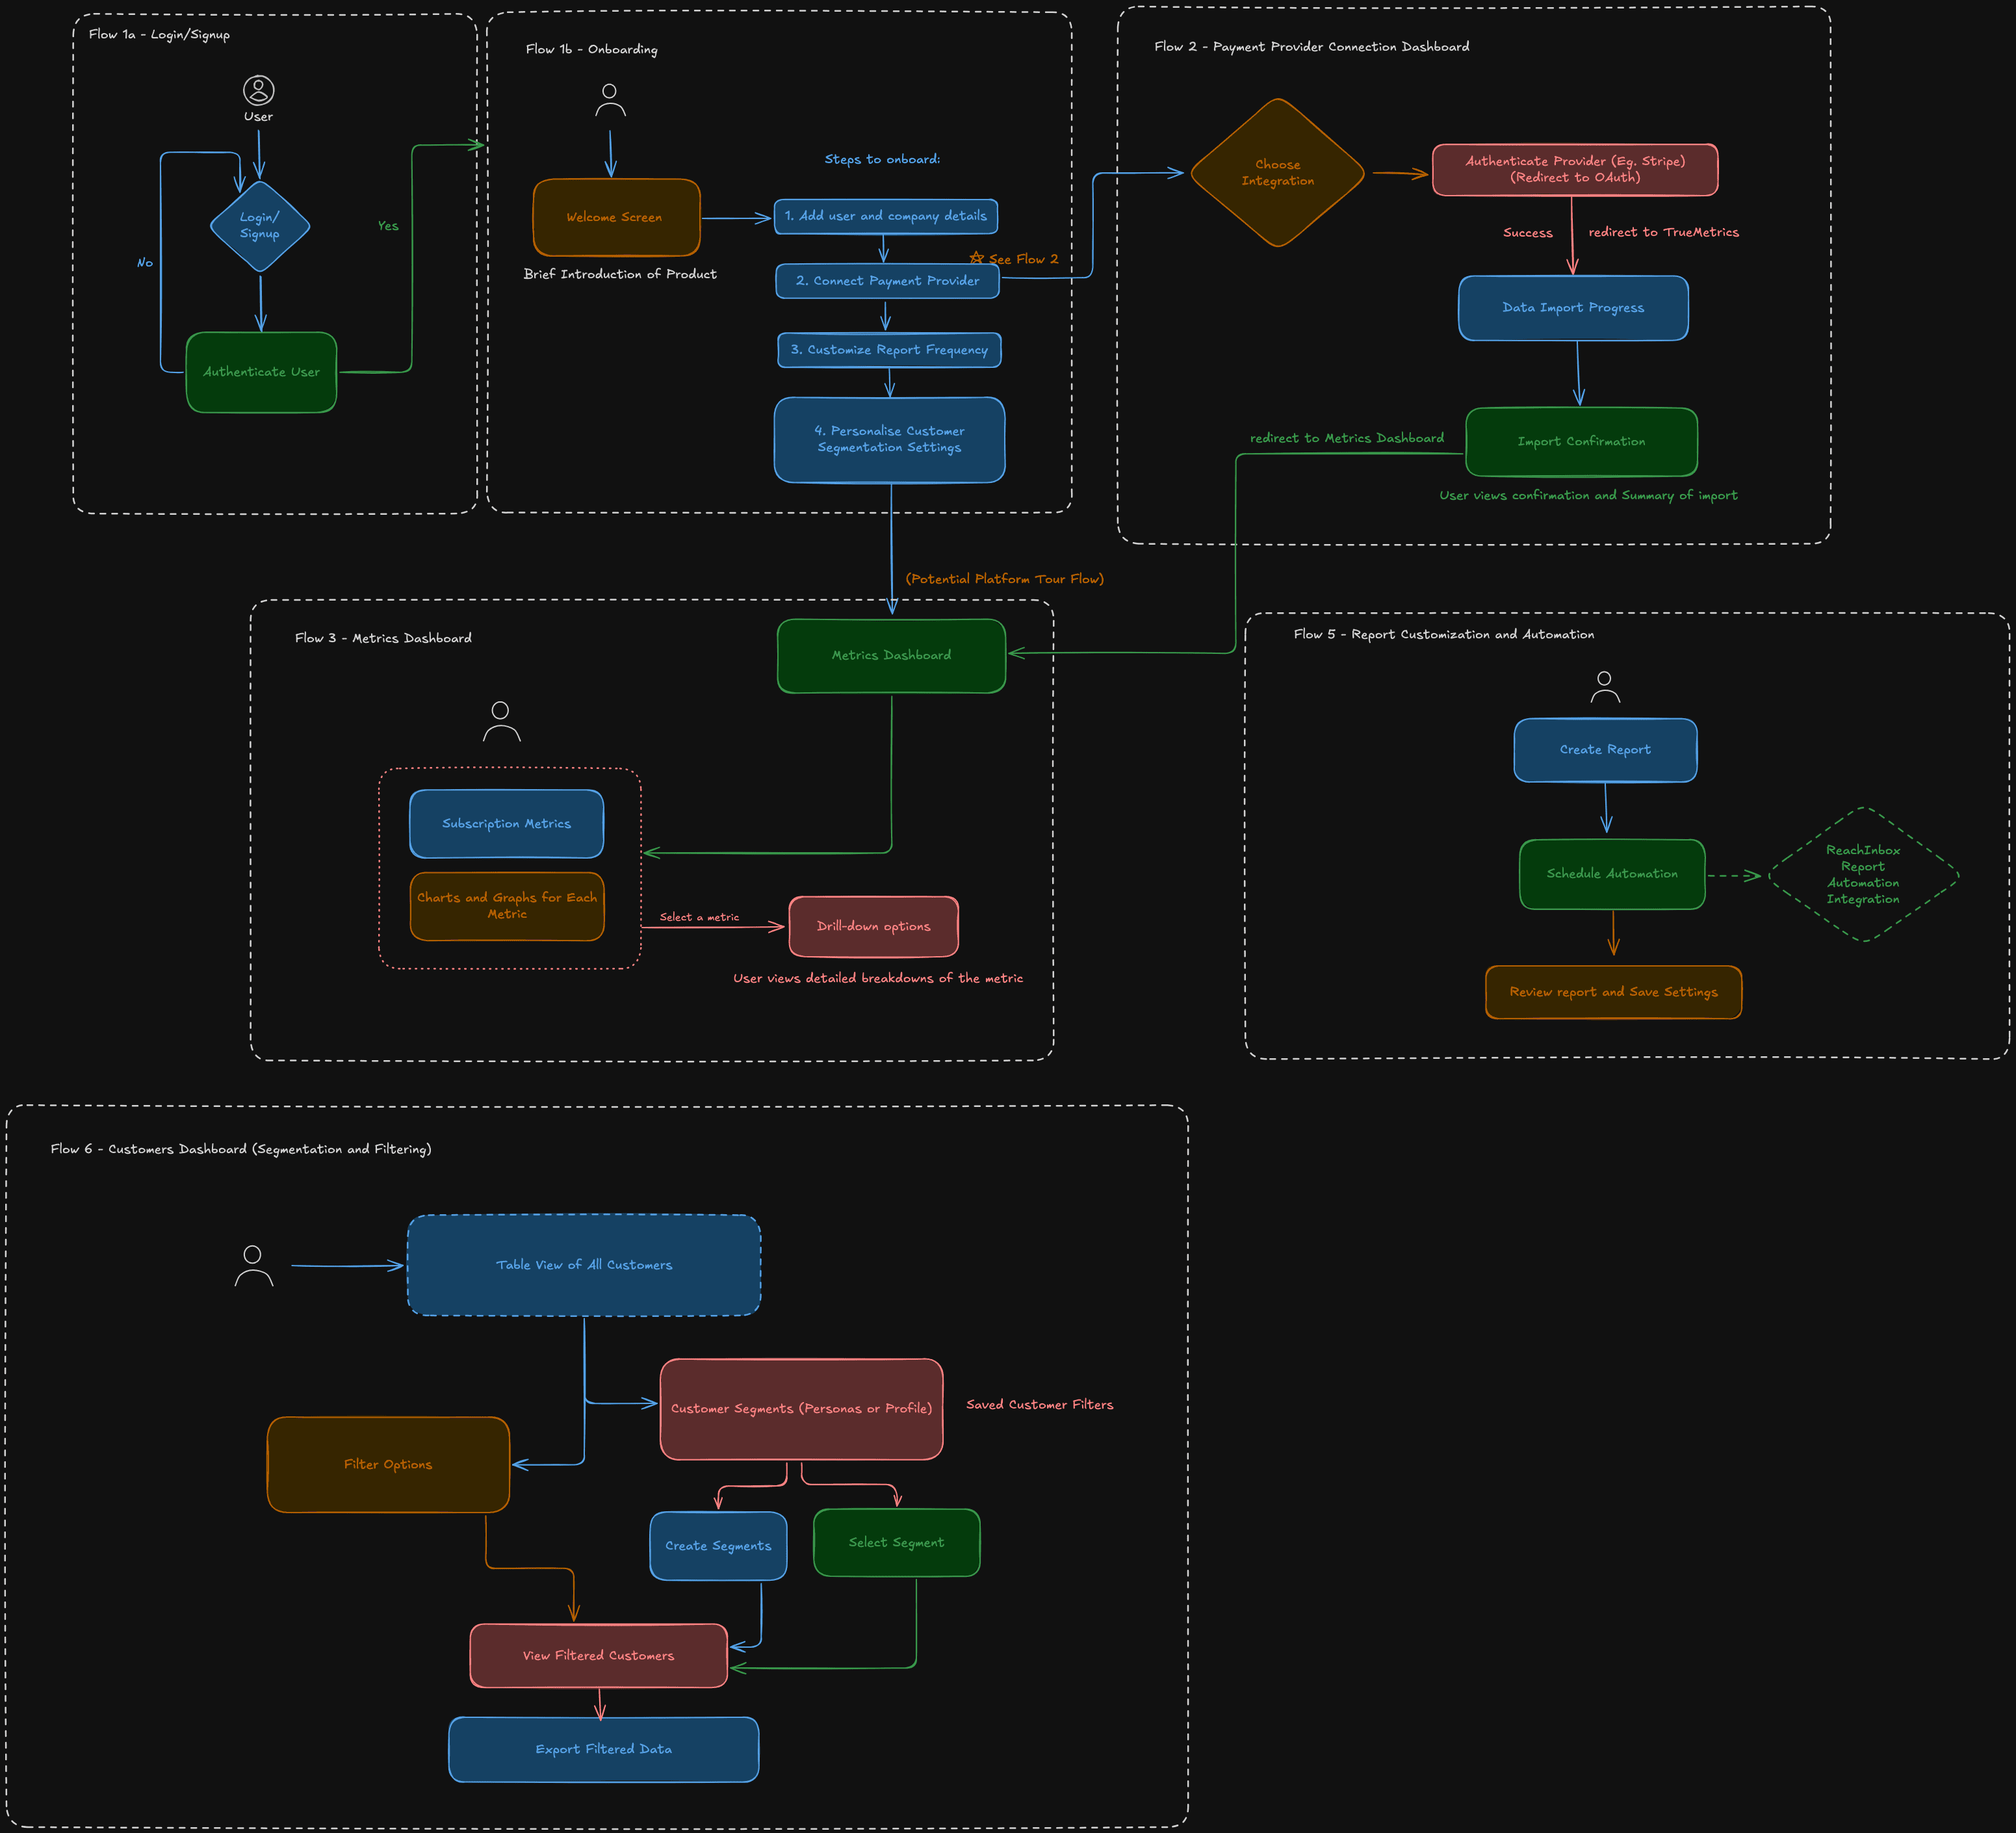
Customer Journey
Connect Data Sources: Link payment platforms (Stripe, Shopify, etc.).
Analyze Dashboard: Explore real-time metrics and customer behaviors.
Benchmark Dashboard: Compare company metrics with industry peers.
Receive Automated Reports: Get custom reports at set intervals.
Utilize Insights: Optimize conversion rates and retention using trial insights and segmentation.
User Stories
As a user, I want to connect payment providers to import financial data seamlessly.
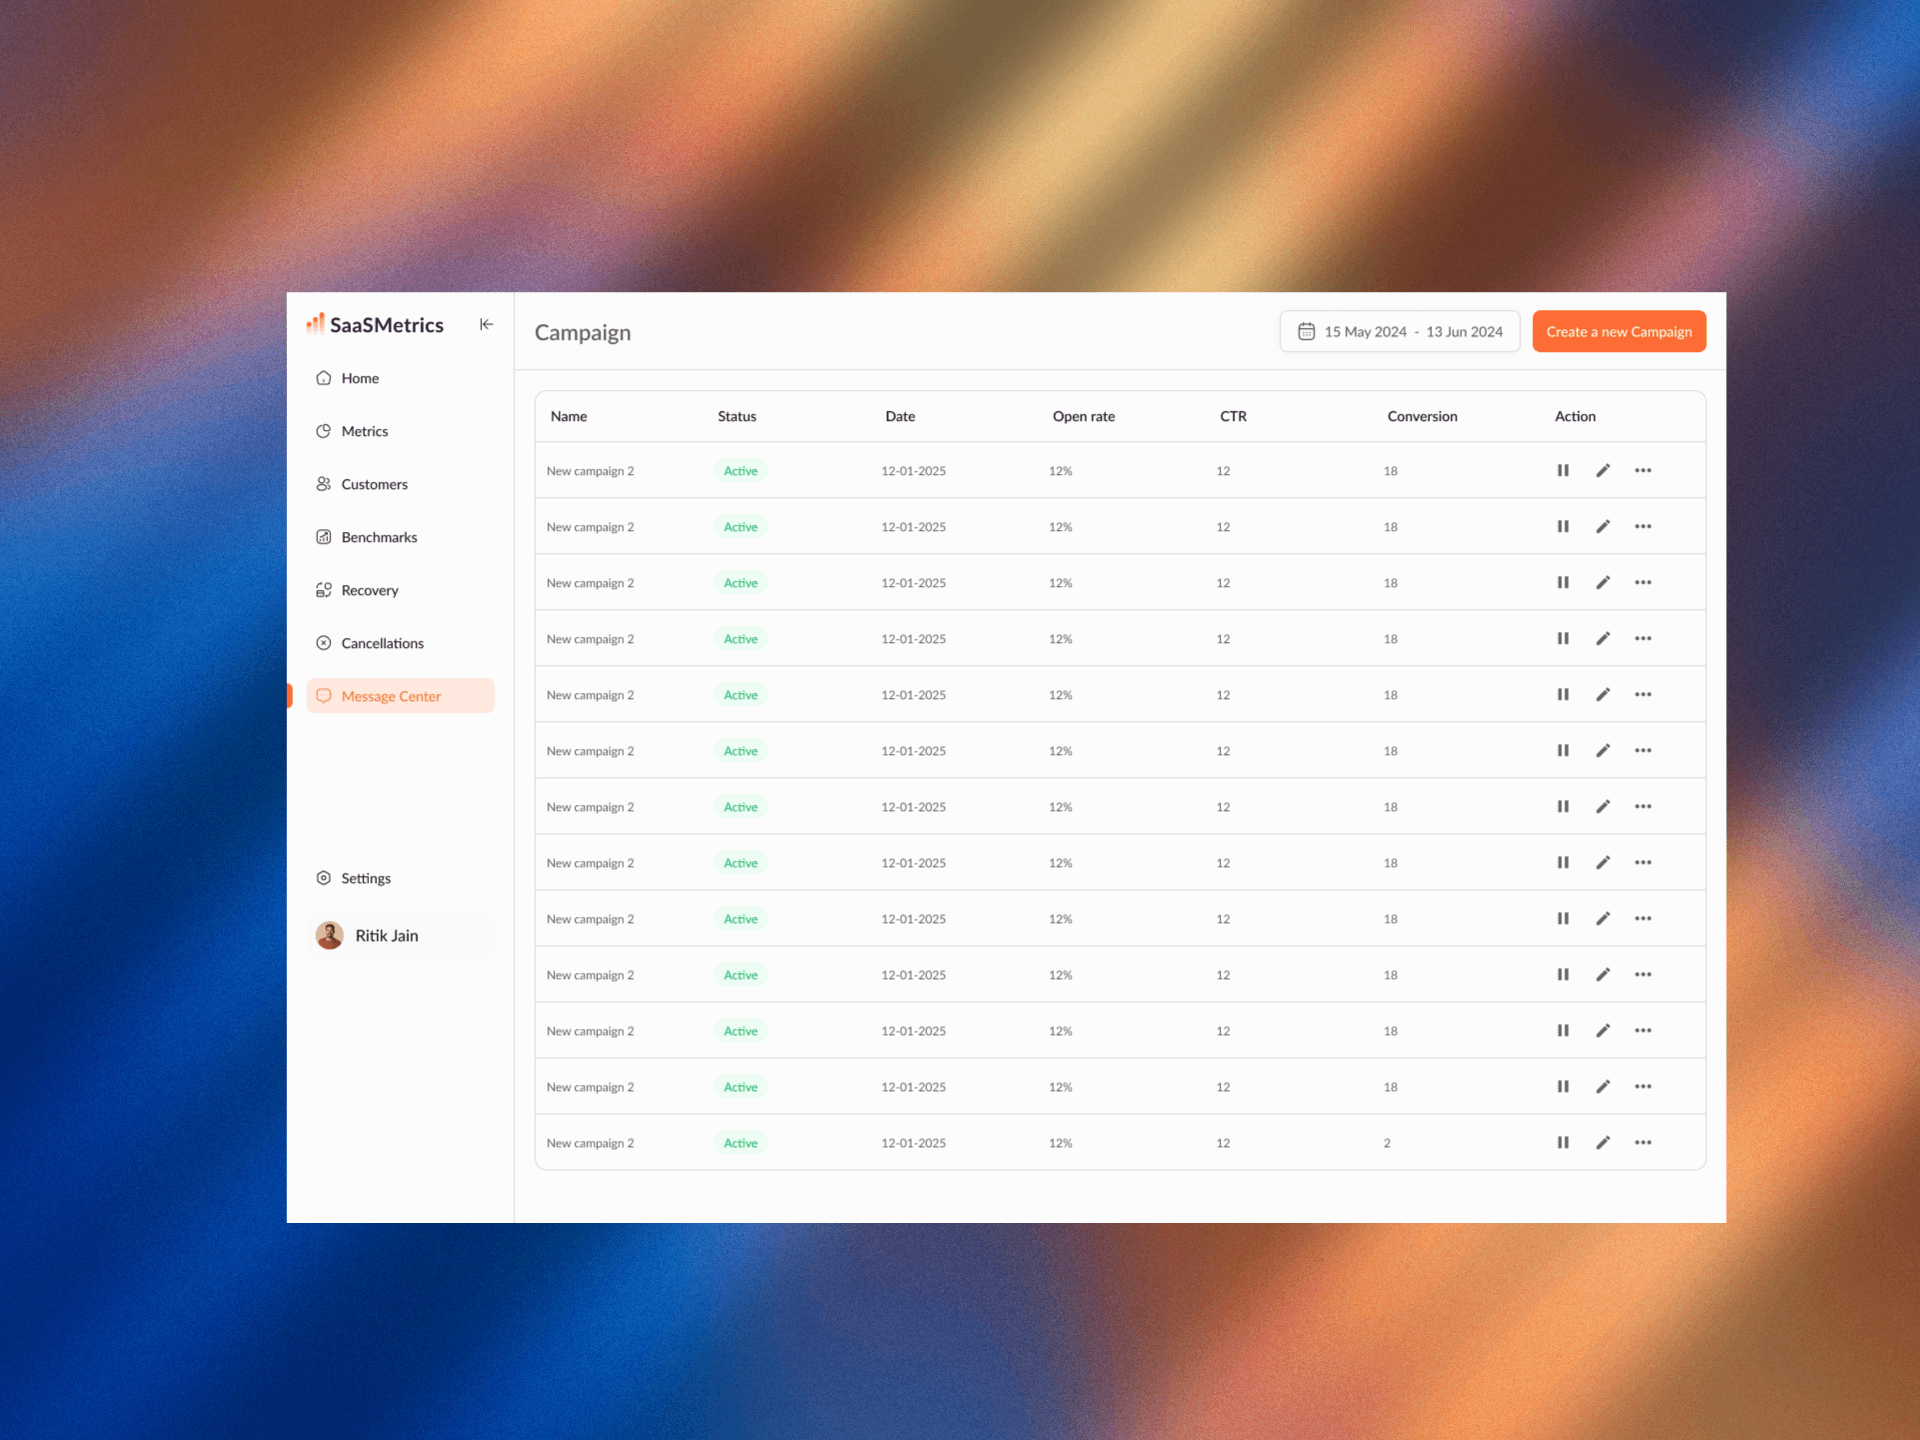
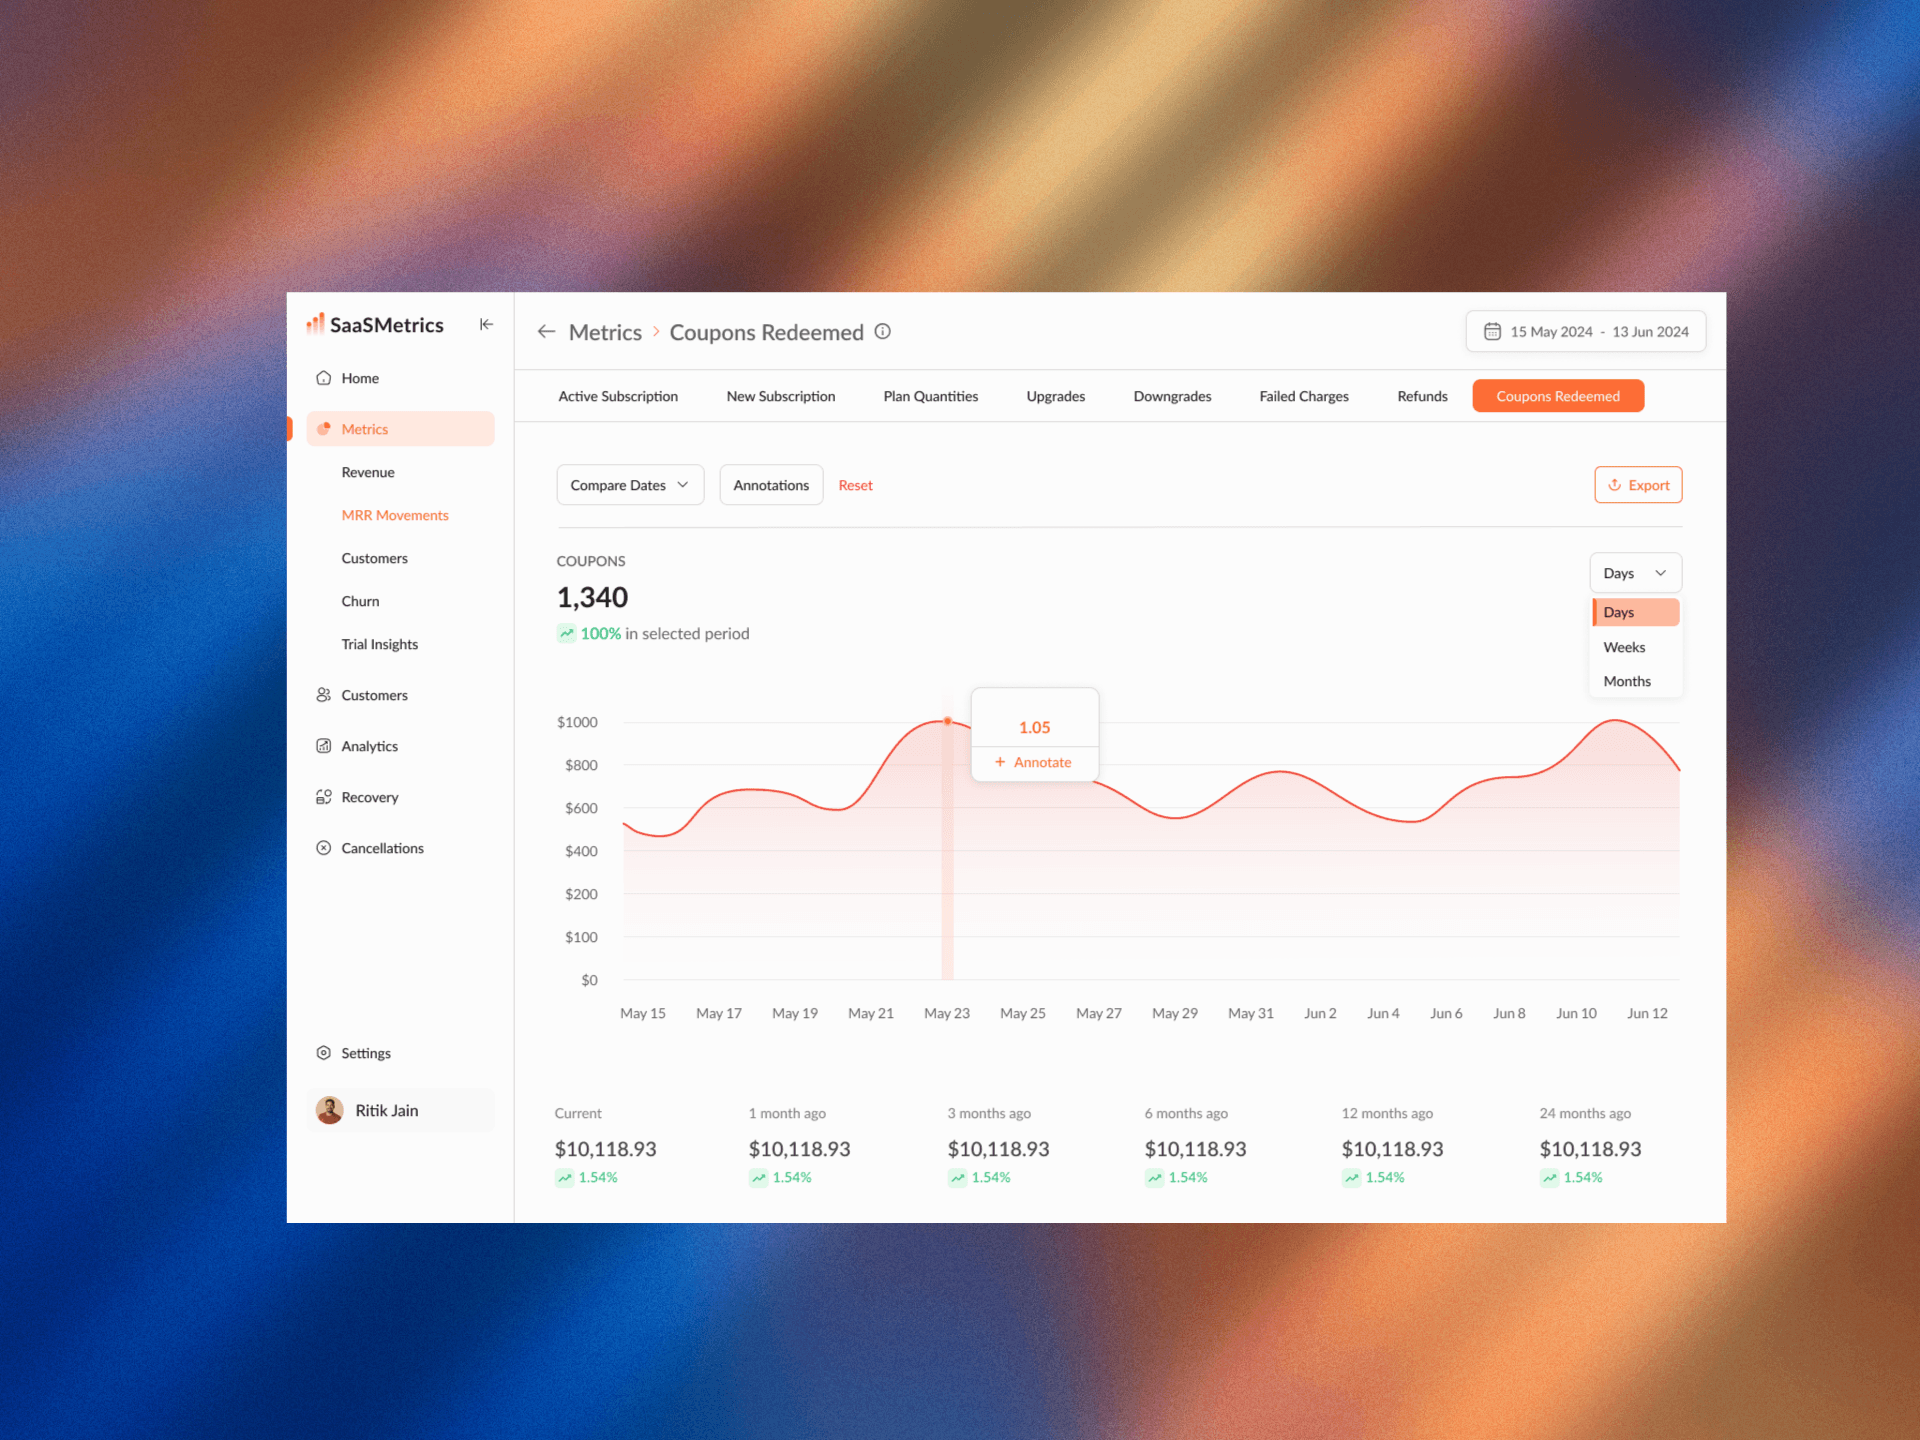
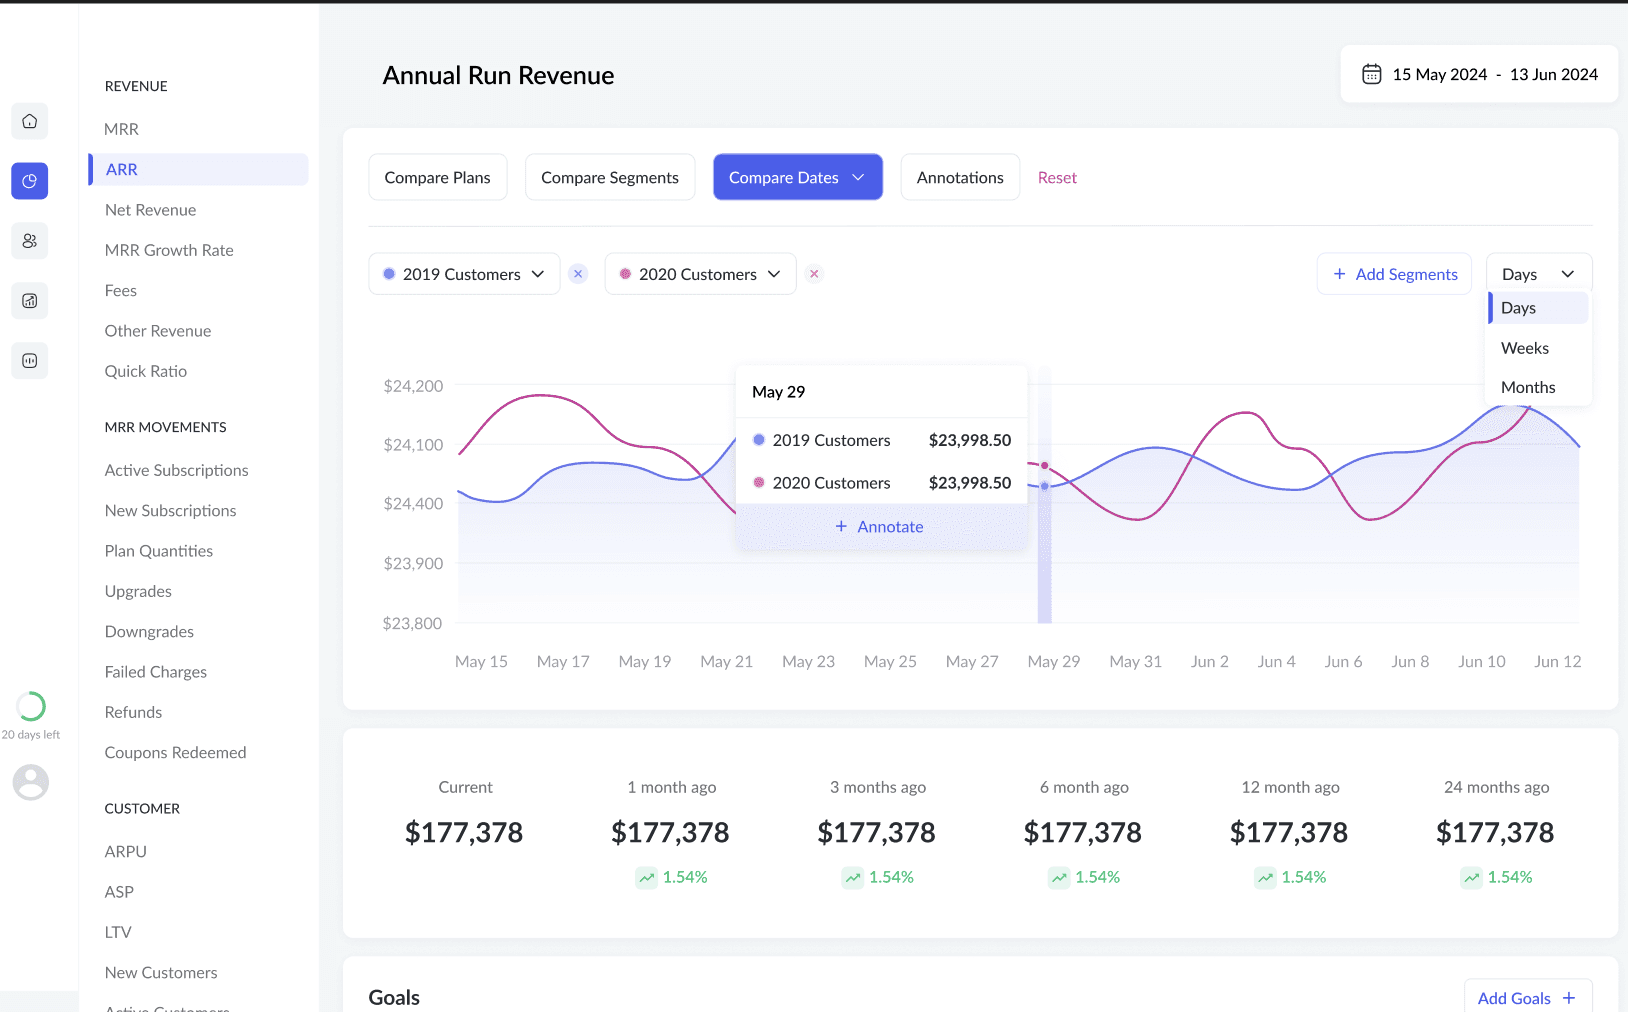
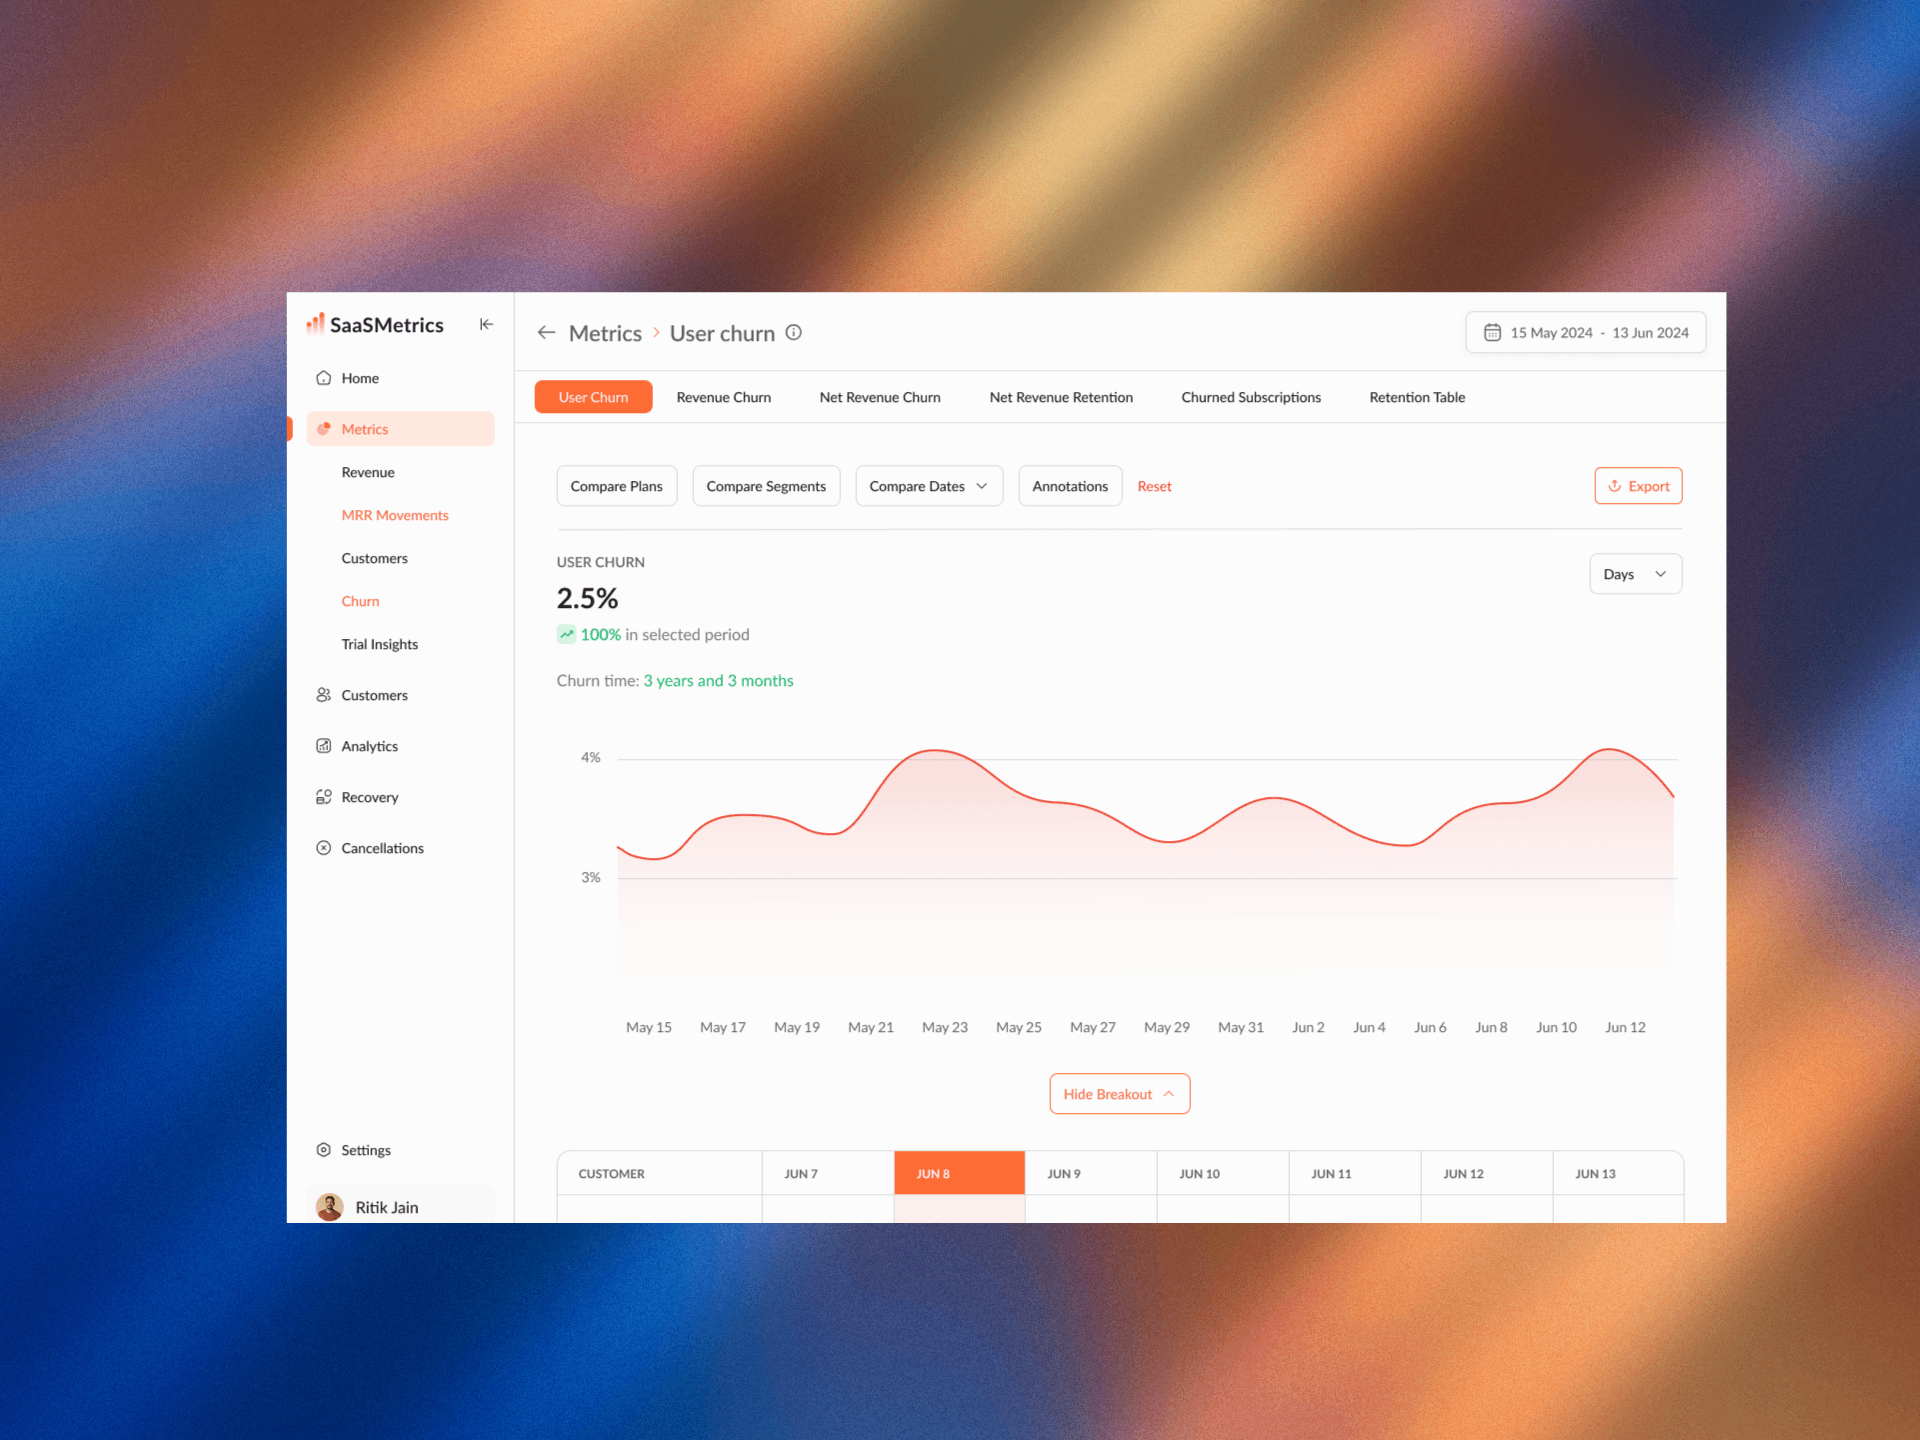
As a user, I want a dashboard showing subscription metrics like MRR and churn.
As a user, I want to benchmark my company’s metrics against others.
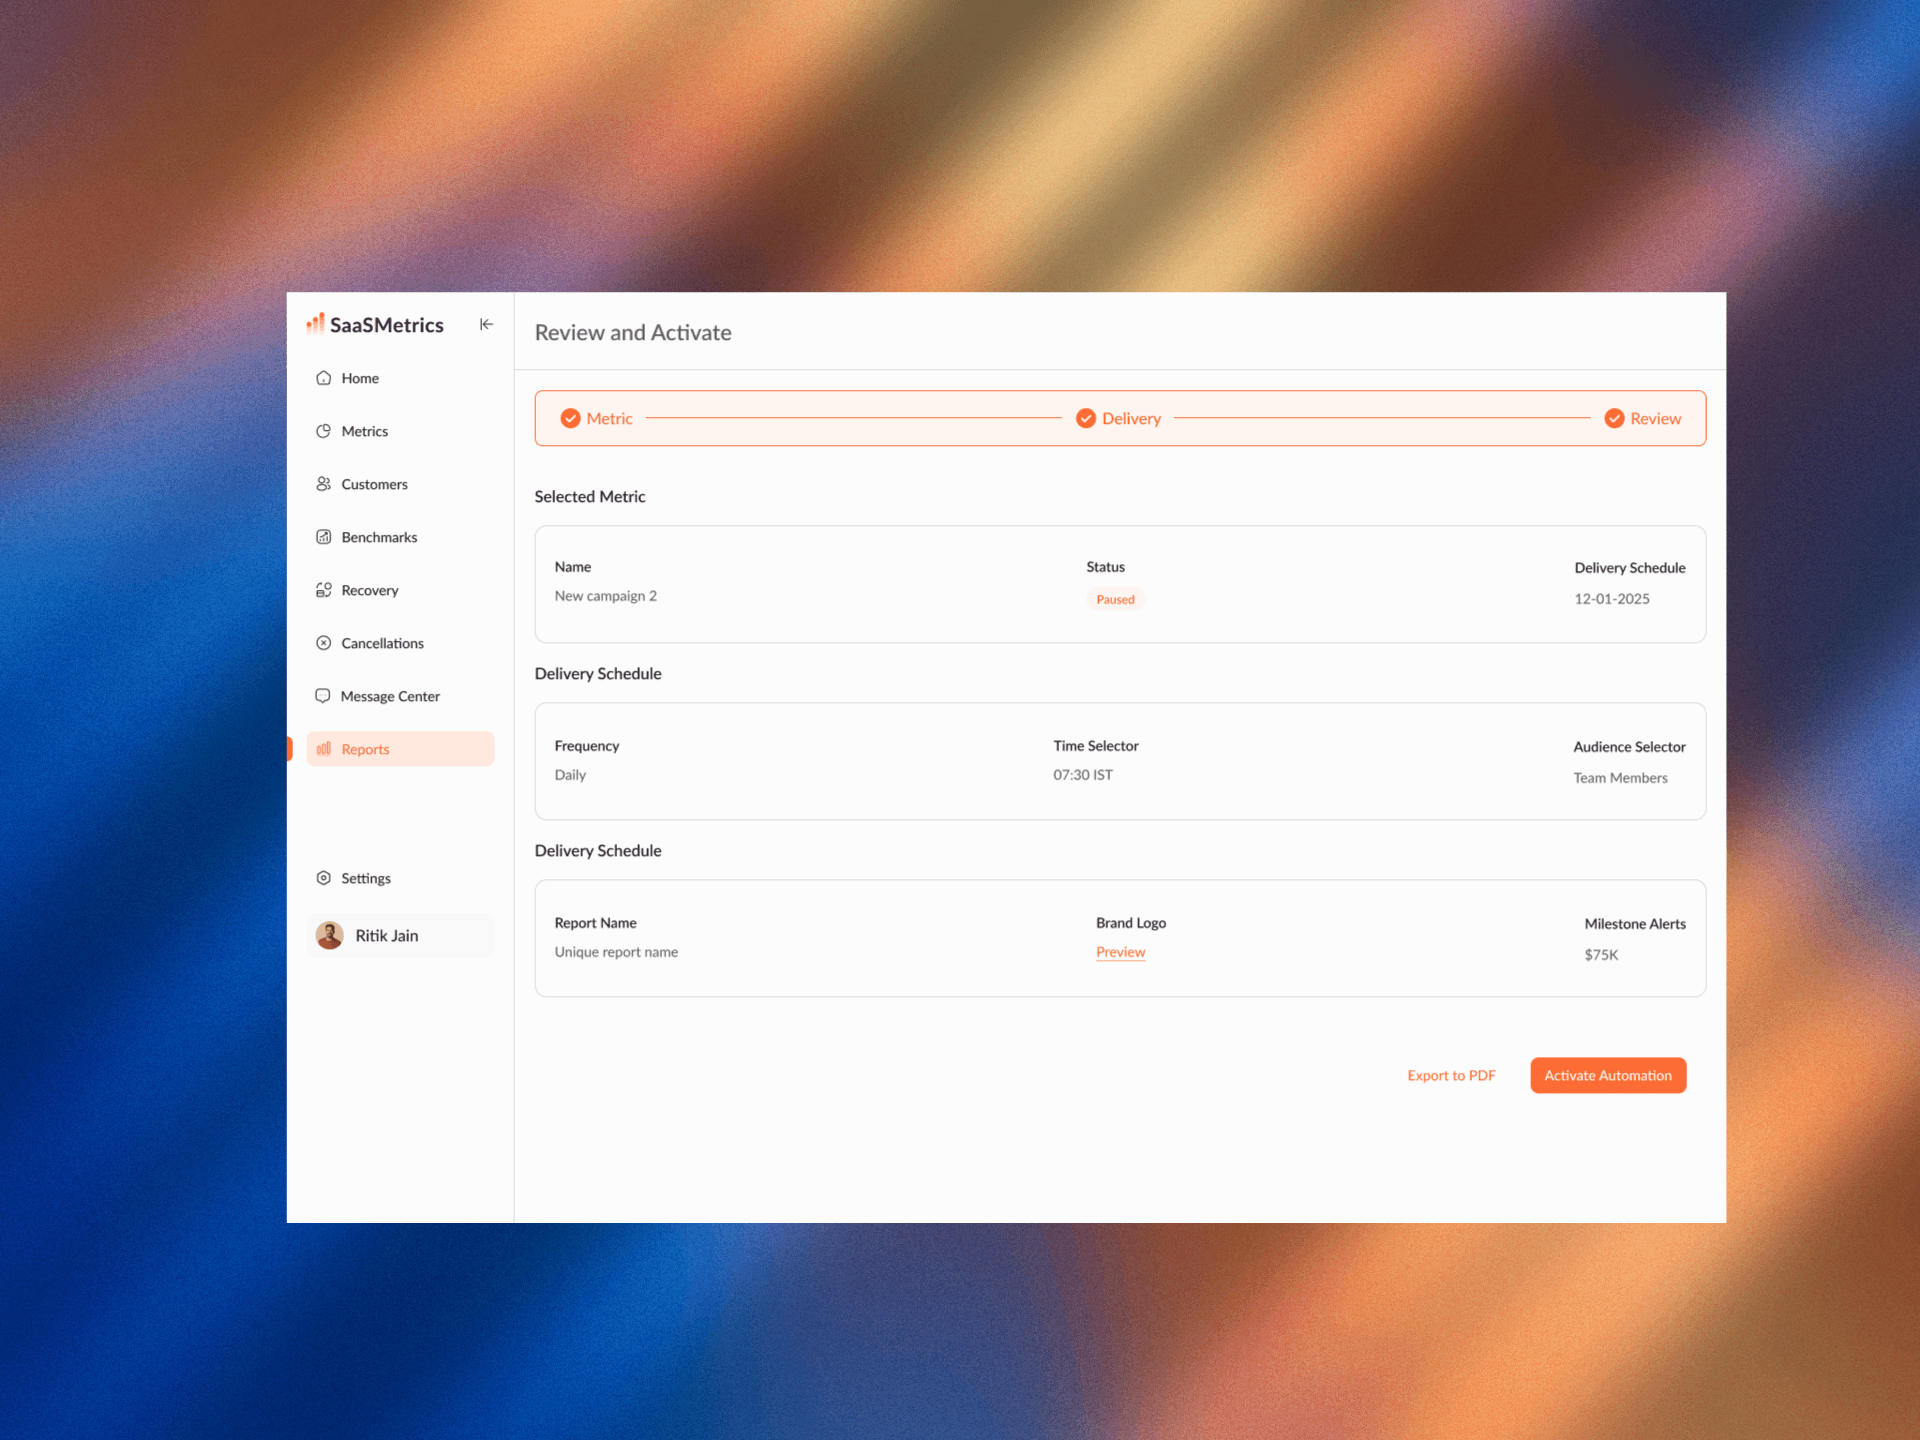
As a user, I want to customize automated reports and dashboards.
As a user, I want to filter and segment customers for better targeting.
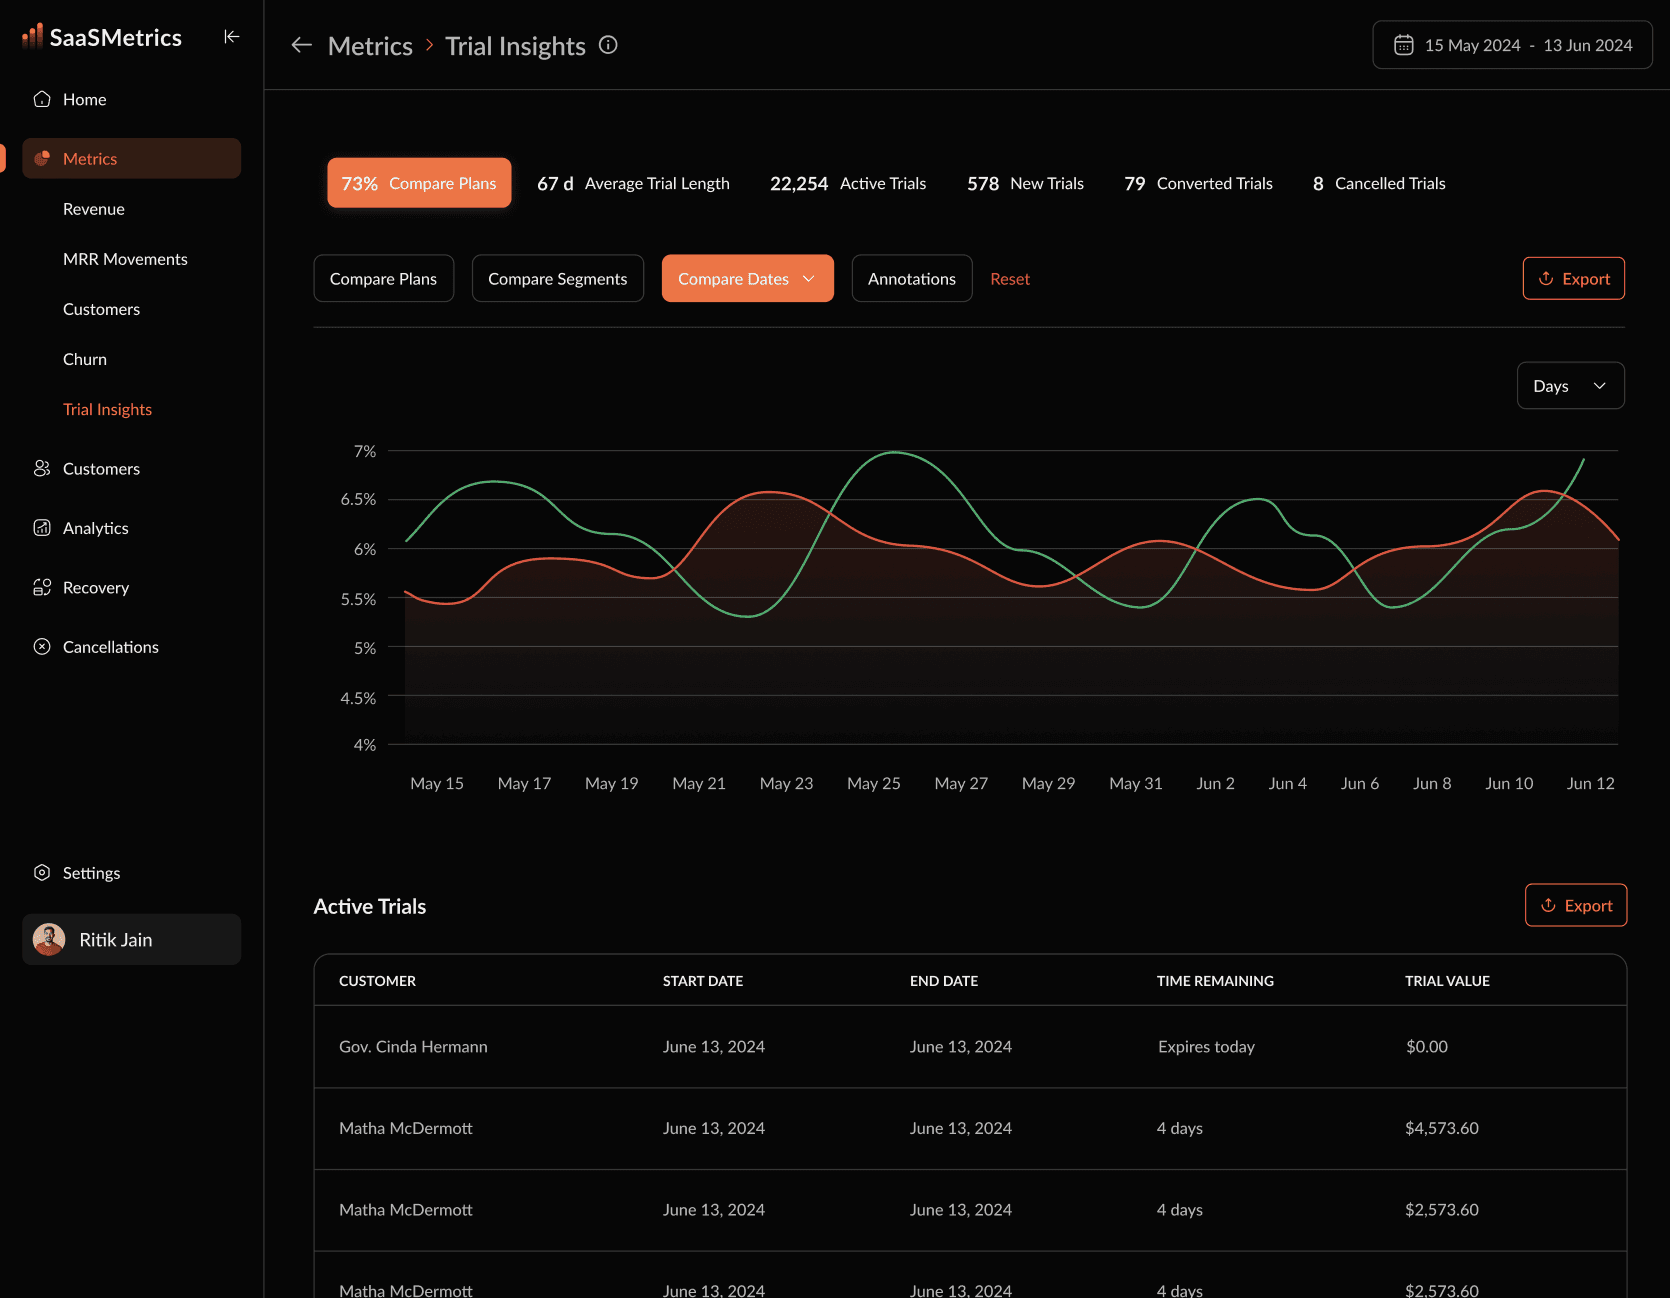
As a user, I want insights on trial metrics to improve conversions.
As a user, I want to manually add subscriptions or customers.
As a user, I want to track all subscription transaction history in one place.
Flow diagrams and wireframes were designed using tldraw to visualize and refine the user experience.
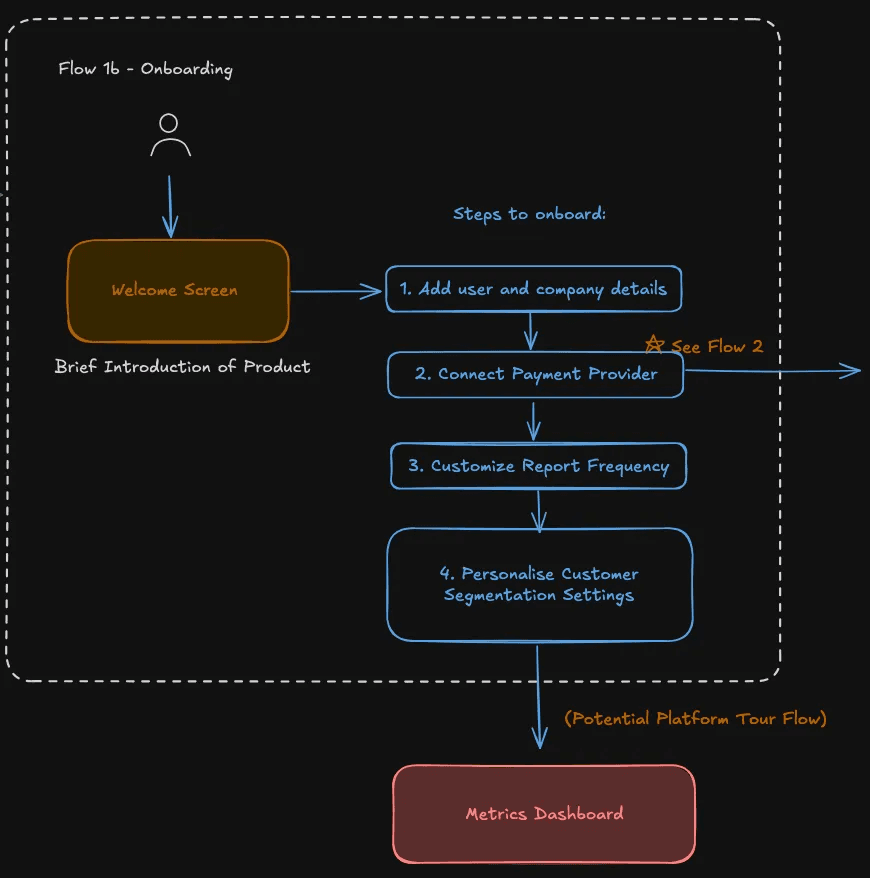
For the full set of wireframes and user flows, please reach out via email at wrk.sumit@gmail.com
Solutions
When we first set out to build SaaSMetrics, our vision was clear: create a simple, unified dashboard for SaaS founders to track their core metrics—MRR, ARR, churn, upgrades, downgrades—and compare themselves to others in the industry. We added automated email reports, trial insights, and customer segmentation, hoping this would cover most needs.
But as we shared early versions with real users—founders, CXOs, and solopreneursthe feedback was honest and invaluable. In the Alpha round, 10 users struggled with navigation and wanted a more intuitive flow. We reworked the layout, making key metrics front and center and streamlining the onboarding.
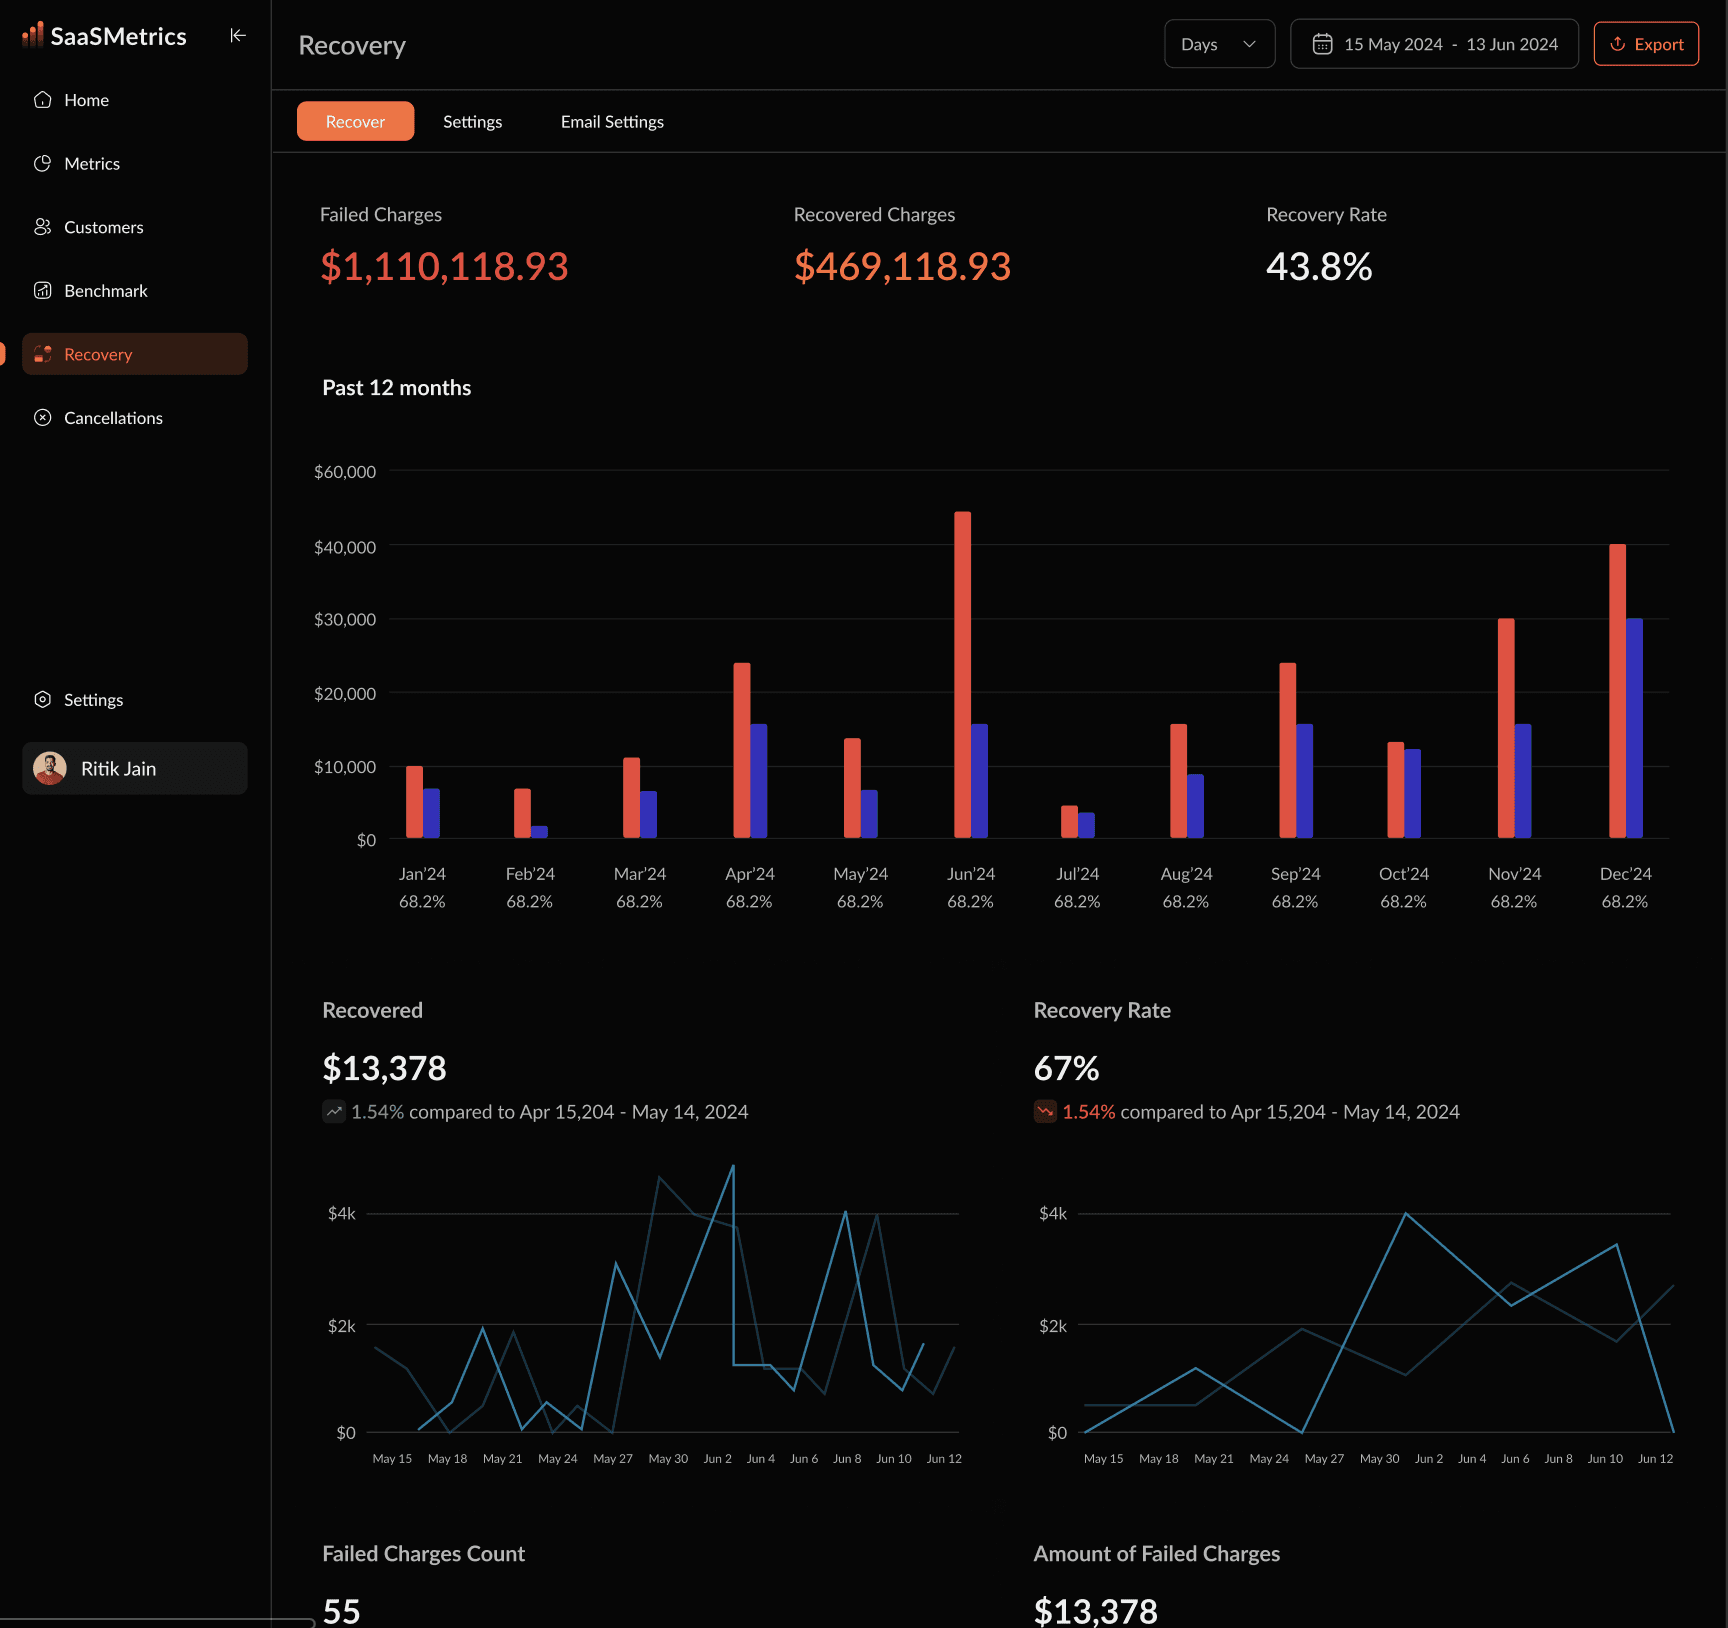
In Beta, 25 testers told us that many metric explanations were too technical. We simplified language, added tooltips, and made sure every chart was easy to understand—even for non-finance users. Users also requested more actionable features, so we prioritized payment recovery automation, forecasting tools, and integrations with platforms like Intercom, QuickBooks, and Xero.
For the final usability test, 50 participants put the platform through its paces. We hit a 95% task completion rate, confirming that most users could onboard, connect data, and generate reports without help. Edge cases—like missing integration data, email reports ending up in spam, and dashboard slowdowns during heavy use were identified and addressed.
Key Insights:
Direct user feedback drove each major improvement.
Simplified navigation and explanations made the product accessible to a wider range of users.
Actionable automation and integrations became clear differentiators.
Usability testing ensured the final product was robust, intuitive, and ready for real-world SaaS teams.
SaaSMetrics is now a platform shaped as much by its users as by its creators—focused, flexible, and built for the realities of running a SaaS business.
User Acceptance Criteria
Data connections function correctly without manual input.
Metrics are displayed accurately in the dashboard.
Automated reports are delivered on schedule.
Edge Cases
Missing or incomplete data from integrations.
Misconfigured email reports leading to spam filters.
Dashboard load times during peak usage.
Business Outcome
Key Metrics to Measure at MVP Launch
User onboarding time
Task completion rate
User satisfaction score
Beta-to-paid conversion rate
Churn rate
Active users
Automated report adoption
Note: Product not yet launched; these are suggested metrics for initial success measurement.
Learning and next steps
Since SaaSMetrics has not yet launched, the primary learning so far is the strong market need for a unified, automated SaaS metrics platform that simplifies complex analytics and improves decision-making for SaaS businesses. Research and competitor analysis have highlighted the importance of features like real-time dashboards, automated reporting, customer segmentation, and payment recovery automation.
Next Steps:
Finalize MVP features and ensure a seamless onboarding experience.
Conduct thorough user testing with a closed beta group to gather feedback on usability and feature effectiveness.
Monitor key metrics such as onboarding time, task completion, and user satisfaction during the beta phase.
Iterate on product design and workflows based on user feedback before public launch.
Develop a go-to-market strategy to build awareness and drive early adoption once the product is ready.